Skip to content
  • Categories
  • Recent
  • Tags
  • Popular
  • World
  • Users
  • Groups
Skins
  • Light
  • Brite
  • Cerulean
  • Cosmo
  • Flatly
  • Journal
  • Litera
  • Lumen
  • Lux
  • Materia
  • Minty
  • Morph
  • Pulse
  • Sandstone
  • Simplex
  • Sketchy
  • Spacelab
  • United
  • Yeti
  • Zephyr
  • Dark
  • Cyborg
  • Darkly
  • Quartz
  • Slate
  • Solar
  • Superhero
  • Vapor

  • Default (Cyborg)
  • No Skin
Collapse
Brand Logo

CIRCLE WITH A DOT

  1. Home
  2. Uncategorized
  3. What's the point of declaring a winter respiratory season when our 'top doctor' doesn't do any mitigations - at all

What's the point of declaring a winter respiratory season when our 'top doctor' doesn't do any mitigations - at all

Scheduled Pinned Locked Moved Uncategorized
bcpolicovidcovid19rsvflu
16 Posts 4 Posters 16 Views
  • Oldest to Newest
  • Newest to Oldest
  • Most Votes
Reply
  • Reply as topic
Log in to reply
This topic has been deleted. Only users with topic management privileges can see it.
  • matwright@mastodon.socialM matwright@mastodon.social

    and calling bullshit on Bonnie, collated Federal data shows Covid spiking, flu going up as well - low prevalence and declining my ass

    Our 'Top Doctor' lying through her teeth

    #Covid #Covid19 #BCpoli #Flu #RSV

    Link Preview Image
    giflian@techhub.socialG This user is from outside of this forum
    giflian@techhub.socialG This user is from outside of this forum
    giflian@techhub.social
    wrote last edited by
    #3

    @MatWright the gaslighting is the point. Get people to feel like it's their personal fault if they get sick since levels are "low"

    matwright@mastodon.socialM 1 Reply Last reply
    0
    • giflian@techhub.socialG giflian@techhub.social

      @MatWright the gaslighting is the point. Get people to feel like it's their personal fault if they get sick since levels are "low"

      matwright@mastodon.socialM This user is from outside of this forum
      matwright@mastodon.socialM This user is from outside of this forum
      matwright@mastodon.social
      wrote last edited by
      #4

      @giflian plus we always get a spring/summer Covid spike because it loves warm weather - 'respiratory season' is nonsense

      1 Reply Last reply
      0
      • matwright@mastodon.socialM matwright@mastodon.social

        and calling bullshit on Bonnie, collated Federal data shows Covid spiking, flu going up as well - low prevalence and declining my ass

        Our 'Top Doctor' lying through her teeth

        #Covid #Covid19 #BCpoli #Flu #RSV

        Link Preview Image
        datum@zeroes.caD This user is from outside of this forum
        datum@zeroes.caD This user is from outside of this forum
        datum@zeroes.ca
        wrote last edited by
        #5

        What radicalized you?
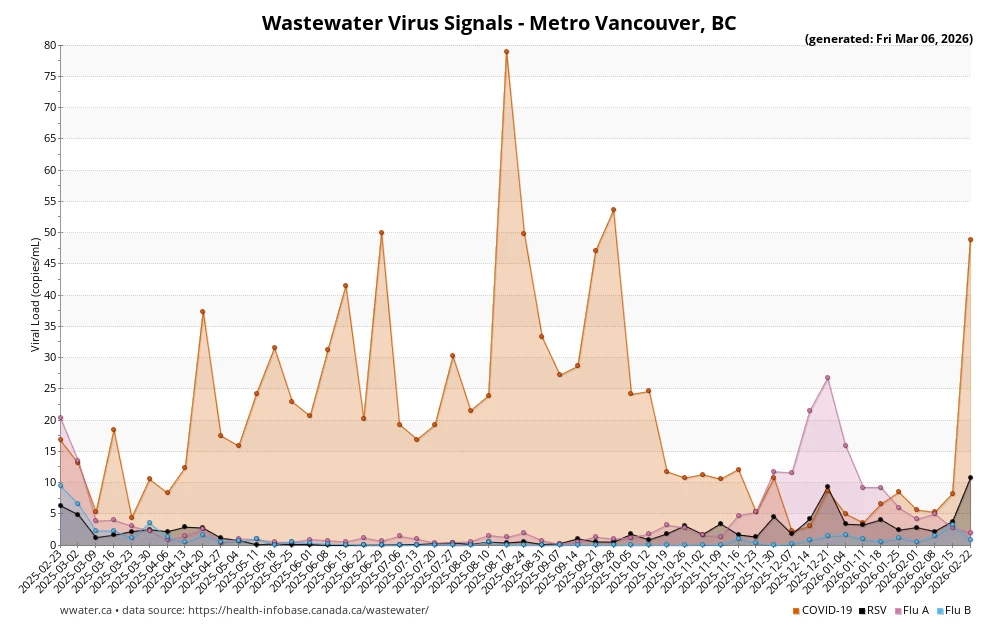
        camera zooms in on the part of the graph on the right where the signal is going nearly vertically up
        (Bonny Henry's voice overlaid) "low prevalence and declining"
        THX sound plays

        thanks @MatWright for putting the data in front of us

        #shitpost

        1 Reply Last reply
        0
        • matwright@mastodon.socialM matwright@mastodon.social

          and calling bullshit on Bonnie, collated Federal data shows Covid spiking, flu going up as well - low prevalence and declining my ass

          Our 'Top Doctor' lying through her teeth

          #Covid #Covid19 #BCpoli #Flu #RSV

          Link Preview Image
          ducky@mstdn.caD This user is from outside of this forum
          ducky@mstdn.caD This user is from outside of this forum
          ducky@mstdn.ca
          wrote last edited by
          #6

          @MatWright I am surprised, as your graph doesn't match what my sources show. For COVID-19, I don't know how they combine the different Metro Van plants, but COVID levels are currently way lower in Fraser than they were in the summer, Richmond is somewhat lower, and Vancouver is about the same. (This is not direct from the province, but from someone whose competence I trust: https://docs.google.com/spreadsheets/d/1t7i2iqi6Ix1xWB4wh84RYsWRNHtZIWj5zKkZnYViw_A/edit .)

          The graph from the federal wastewater page for Metro Van doesn't look like your graph either: it shows that there is a rise right now, but at about half the level of the summer peak: https://health-infobase.canada.ca/wastewater/

          The province's charts -- which are the same as my friend's, only smoothed -- also show that levels are lower than they were in the summer: https://bccdc.shinyapps.io/respiratory_wastewater/

          As for Influenza A, the province's graphs show Flu A almost gone.

          Link Preview ImageLink Preview ImageLink Preview ImageLink Preview Image
          ducky@mstdn.caD 1 Reply Last reply
          0
          • ducky@mstdn.caD ducky@mstdn.ca

            @MatWright I am surprised, as your graph doesn't match what my sources show. For COVID-19, I don't know how they combine the different Metro Van plants, but COVID levels are currently way lower in Fraser than they were in the summer, Richmond is somewhat lower, and Vancouver is about the same. (This is not direct from the province, but from someone whose competence I trust: https://docs.google.com/spreadsheets/d/1t7i2iqi6Ix1xWB4wh84RYsWRNHtZIWj5zKkZnYViw_A/edit .)

            The graph from the federal wastewater page for Metro Van doesn't look like your graph either: it shows that there is a rise right now, but at about half the level of the summer peak: https://health-infobase.canada.ca/wastewater/

            The province's charts -- which are the same as my friend's, only smoothed -- also show that levels are lower than they were in the summer: https://bccdc.shinyapps.io/respiratory_wastewater/

            As for Influenza A, the province's graphs show Flu A almost gone.

            Link Preview ImageLink Preview ImageLink Preview ImageLink Preview Image
            ducky@mstdn.caD This user is from outside of this forum
            ducky@mstdn.caD This user is from outside of this forum
            ducky@mstdn.ca
            wrote last edited by
            #7

            @MatWright My own graphs, with data that I scrape from the province's Viral Pathogens page, shows that reported influenza A cases (light blue line) are also way down: https://bccdc.shinyapps.io/respiratory_pathogen_characterization/ So I agree with your flu line, but am puzzled by your COVID line.

            Where are you getting your data from?

            Link Preview ImageLink Preview Image
            ducky@mstdn.caD 1 Reply Last reply
            0
            • ducky@mstdn.caD ducky@mstdn.ca

              @MatWright My own graphs, with data that I scrape from the province's Viral Pathogens page, shows that reported influenza A cases (light blue line) are also way down: https://bccdc.shinyapps.io/respiratory_pathogen_characterization/ So I agree with your flu line, but am puzzled by your COVID line.

              Where are you getting your data from?

              Link Preview ImageLink Preview Image
              ducky@mstdn.caD This user is from outside of this forum
              ducky@mstdn.caD This user is from outside of this forum
              ducky@mstdn.ca
              wrote last edited by
              #8

              @MatWright LOL I just now saw the URL at the bottom of your graph -- I see now it's from the federal wastewater page. Why does yours look so different than mine, both in terms of content and presentation?

              ducky@mstdn.caD 1 Reply Last reply
              0
              • ducky@mstdn.caD ducky@mstdn.ca

                @MatWright LOL I just now saw the URL at the bottom of your graph -- I see now it's from the federal wastewater page. Why does yours look so different than mine, both in terms of content and presentation?

                ducky@mstdn.caD This user is from outside of this forum
                ducky@mstdn.caD This user is from outside of this forum
                ducky@mstdn.ca
                wrote last edited by
                #9

                @MatWright Gah. And now I see wwater.ca in small letters. And they do in fact show a radically different shape to their COVID-19 graph. I don't know why.

                matwright@mastodon.socialM 1 Reply Last reply
                0
                • ducky@mstdn.caD ducky@mstdn.ca

                  @MatWright Gah. And now I see wwater.ca in small letters. And they do in fact show a radically different shape to their COVID-19 graph. I don't know why.

                  matwright@mastodon.socialM This user is from outside of this forum
                  matwright@mastodon.socialM This user is from outside of this forum
                  matwright@mastodon.social
                  wrote last edited by
                  #10

                  @ducky I've always thought Federal data is more accurate than BC CDC, especially stating in 2022 when BC was called out for changing it's X/Y visualization which flattened Covid lines

                  Also my read is that Fed Health uses a different calculation to extrapolate infection rate from WW, more realistic than BC CDC

                  ducky@mstdn.caD 1 Reply Last reply
                  0
                  • matwright@mastodon.socialM matwright@mastodon.social

                    @ducky I've always thought Federal data is more accurate than BC CDC, especially stating in 2022 when BC was called out for changing it's X/Y visualization which flattened Covid lines

                    Also my read is that Fed Health uses a different calculation to extrapolate infection rate from WW, more realistic than BC CDC

                    ducky@mstdn.caD This user is from outside of this forum
                    ducky@mstdn.caD This user is from outside of this forum
                    ducky@mstdn.ca
                    wrote last edited by
                    #11

                    @MatWright I empathize, but the fed data doesn't look like the wwater.ca data either. The fed data *also* had the current COVID peak as only like 72% as high as the summer peak.

                    Link Preview Image
                    matwright@mastodon.socialM 1 Reply Last reply
                    2
                    0
                    • R relay@relay.mycrowd.ca shared this topic
                      R relay@relay.infosec.exchange shared this topic
                    • ducky@mstdn.caD ducky@mstdn.ca

                      @MatWright I empathize, but the fed data doesn't look like the wwater.ca data either. The fed data *also* had the current COVID peak as only like 72% as high as the summer peak.

                      Link Preview Image
                      matwright@mastodon.socialM This user is from outside of this forum
                      matwright@mastodon.socialM This user is from outside of this forum
                      matwright@mastodon.social
                      wrote last edited by
                      #12

                      @ducky oh, for sure, but my rant was Bonnie Henry trying to claim Covid in BC had flatlined and was no longer a huge community threat, when in fact it is climbing

                      I mean, one good thing is that winter surge here was the lowest really ever, so we might be entering a realm of high endemic levels. I guess we'll see over the summer, especially if a new mutation appears

                      ducky@mstdn.caD 1 Reply Last reply
                      0
                      • matwright@mastodon.socialM matwright@mastodon.social

                        @ducky oh, for sure, but my rant was Bonnie Henry trying to claim Covid in BC had flatlined and was no longer a huge community threat, when in fact it is climbing

                        I mean, one good thing is that winter surge here was the lowest really ever, so we might be entering a realm of high endemic levels. I guess we'll see over the summer, especially if a new mutation appears

                        ducky@mstdn.caD This user is from outside of this forum
                        ducky@mstdn.caD This user is from outside of this forum
                        ducky@mstdn.ca
                        wrote last edited by
                        #13

                        @MatWright My bad. I took a more careful look at the federal numbers, and yeah, the current level is at about 72% of the summer spike. I was mislead because the flattening of the curve makes it look like there's not much difference between the 28 Sept spike and the 17 Aug spike, when in fact there is a big difference. I was comparing the 2 Feb spike to the 28 Sept spike and not the 17 Aug spike.

                        matwright@mastodon.socialM 1 Reply Last reply
                        1
                        0
                        • ducky@mstdn.caD ducky@mstdn.ca

                          @MatWright My bad. I took a more careful look at the federal numbers, and yeah, the current level is at about 72% of the summer spike. I was mislead because the flattening of the curve makes it look like there's not much difference between the 28 Sept spike and the 17 Aug spike, when in fact there is a big difference. I was comparing the 2 Feb spike to the 28 Sept spike and not the 17 Aug spike.

                          matwright@mastodon.socialM This user is from outside of this forum
                          matwright@mastodon.socialM This user is from outside of this forum
                          matwright@mastodon.social
                          wrote last edited by
                          #14

                          @ducky that's the game - playing with visualizations - you need the raw data and graph yourself

                          ducky@mstdn.caD 1 Reply Last reply
                          0
                          • matwright@mastodon.socialM matwright@mastodon.social

                            @ducky that's the game - playing with visualizations - you need the raw data and graph yourself

                            ducky@mstdn.caD This user is from outside of this forum
                            ducky@mstdn.caD This user is from outside of this forum
                            ducky@mstdn.ca
                            wrote last edited by
                            #15

                            @MatWright Hmm, the province reports in copies per person per day, while the feds report in copies per mL -- which I think isn't as accurate. I wonder if that means the high signal in Surrey is getting over-represented somehow?

                            It will be interesting to see what data the province puts out next week.

                            ducky@mstdn.caD 1 Reply Last reply
                            0
                            • ducky@mstdn.caD ducky@mstdn.ca

                              @MatWright Hmm, the province reports in copies per person per day, while the feds report in copies per mL -- which I think isn't as accurate. I wonder if that means the high signal in Surrey is getting over-represented somehow?

                              It will be interesting to see what data the province puts out next week.

                              ducky@mstdn.caD This user is from outside of this forum
                              ducky@mstdn.caD This user is from outside of this forum
                              ducky@mstdn.ca
                              wrote last edited by
                              #16

                              @MatWright Aaand the federal chart and https://wwater.ca/British_Columbia/Metro_Vancouver are both down again. I don't know what that spike was.

                              Link Preview Image
                              1 Reply Last reply
                              1
                              0
                              Reply
                              • Reply as topic
                              Log in to reply
                              • Oldest to Newest
                              • Newest to Oldest
                              • Most Votes


                              • Login

                              • Login or register to search.
                              • First post
                                Last post
                              0
                              • Categories
                              • Recent
                              • Tags
                              • Popular
                              • World
                              • Users
                              • Groups