simontatham@hachyderm.io
Posts
-
Dear Lazyfedi, can anyone recommend a software tool for hand-directed graph layout? -
Dear Lazyfedi, can anyone recommend a software tool for hand-directed graph layout?@dysfun yes, I've used that once in a similar context – unlike Inkscape, it understands the idea of an arrow being attached to a box so that dragging the box moves the arrow endpoint too. But I think it has the same problem as my silly idea of using Untangle: only straight edges, where I'm likely to need them to curve.
-
Dear Lazyfedi, can anyone recommend a software tool for hand-directed graph layout?(I have considered the option of using 'Untangle' from my puzzle collection! Encode my graph as an Untangle game description; drag the vertices around in the game until it looks reasonable; recover their final positions from a saved game file. But Untangle only knows how to draw straight-line edges, and can't make the edges swerve around things that are in the way.)
-
Dear Lazyfedi, can anyone recommend a software tool for hand-directed graph layout?Dear Lazyfedi, can anyone recommend a software tool for hand-directed graph layout?
If I have a graph (say, of a finite state machine or something), I can write it in Graphviz DOT format and feed it to xdot, which will do a complete job of layout: decide where the nodes go, figure out some nice curved paths for the edges so they don't go through other nodes or cross over too often.
But if it doesn't do a good enough job, I don't know of any way to slightly tweak its output. As far as I know there's no way I can overrule its decisions about where to put the vertices, but still have it do the rest of the job for me like drawing all the edges. If I'm not 100% happy with its own choices, I have to do the whole thing myself instead.
Anyone know of a good interactive tool that will let me drag the vertices around, and automatically move the edges with them?
-
"I came here in a taxi with the number 1729.@cobratbq no, I think people who tell the Ramanujan story don't normally go on to mention that connection.
People who teach about Carmichael numbers totally do, though!
-
"I came here in a taxi with the number 1729.@cobratbq yes – that's the original version which I'm spoofing.
Hardy went to see Ramanujan and remarked that his taxi had had that dull number. Ramanujan knew it wasn't dull, because it's 10³ + 9³ and also 12³ + 1³, and no smaller integer can be written as two different sums of cubes like that.
(I presume he knew that because he'd once noticed that 12³=1728 and 9³=729 ended in nearly the same digits, and followed up to see if there was an interesting consequence of that.)
That story was enough to make 1729 a very famous integer among mathematicians. But it later turned out to have a _second_ interesting property! It's also a Carmichael number, which are numbers that look enough like primes to consistently fool the otherwise-pretty-good Fermat primality test, even though they aren't prime at all.
-
"I came here in a taxi with the number 1729."I came here in a taxi with the number 1729. What a dull number that is."
"On the contrary, it's a very interesting number! When it appears on my clock, it means it's one minute to going-home time."
-
I've recently been rewriting my substitution-tiling transducers code in #RustLang, replacing the old Sage code.@benjohn there certainly _is_ structure of that kind in the Spectre tiling. Indeed that's exactly what's represented in the symbolic tile addresses handled by my transducer system.
But it's not so easy to relate it back to geometry. The canonical approach is Arnaud Chéritat's "4d lift" concept, in which you express every vertex of a Spectre tile as a pair of complex numbers, with edges at even multiples of 30° incrementing one of the numbers and odd multiples incrementing the other. Once you do that, the geometry becomes simpler, because you can use a linear transformation (aka a 2×2 complex matrix) to transform the vertices of a tile into the vertices of its deflation or inflation, ascending and descending the hierarchy. This is great for theory, but a royal pain when you try to squash it all back into the plane!
-
I've recently been rewriting my substitution-tiling transducers code in #RustLang, replacing the old Sage code.@bellinghman yes, when there was an Ubuntu package of it the package was called 'sagemath'. I assumed that was Ubuntu (or rather Debian) disambiguating among their own package names, but perhaps that's the official upstream name now?
It may be possible to install it _somehow_ on Ubuntu 24.04. But in 22.04 you could just 'apt install sagemath' and not have to even work out how. I think the problem in 24.04 had to do with them upgrading the distro version of Python, and Sage played badly with the new version in some way. But I'd expected that by now it would have been sorted out and the package would have been reinstated.
-
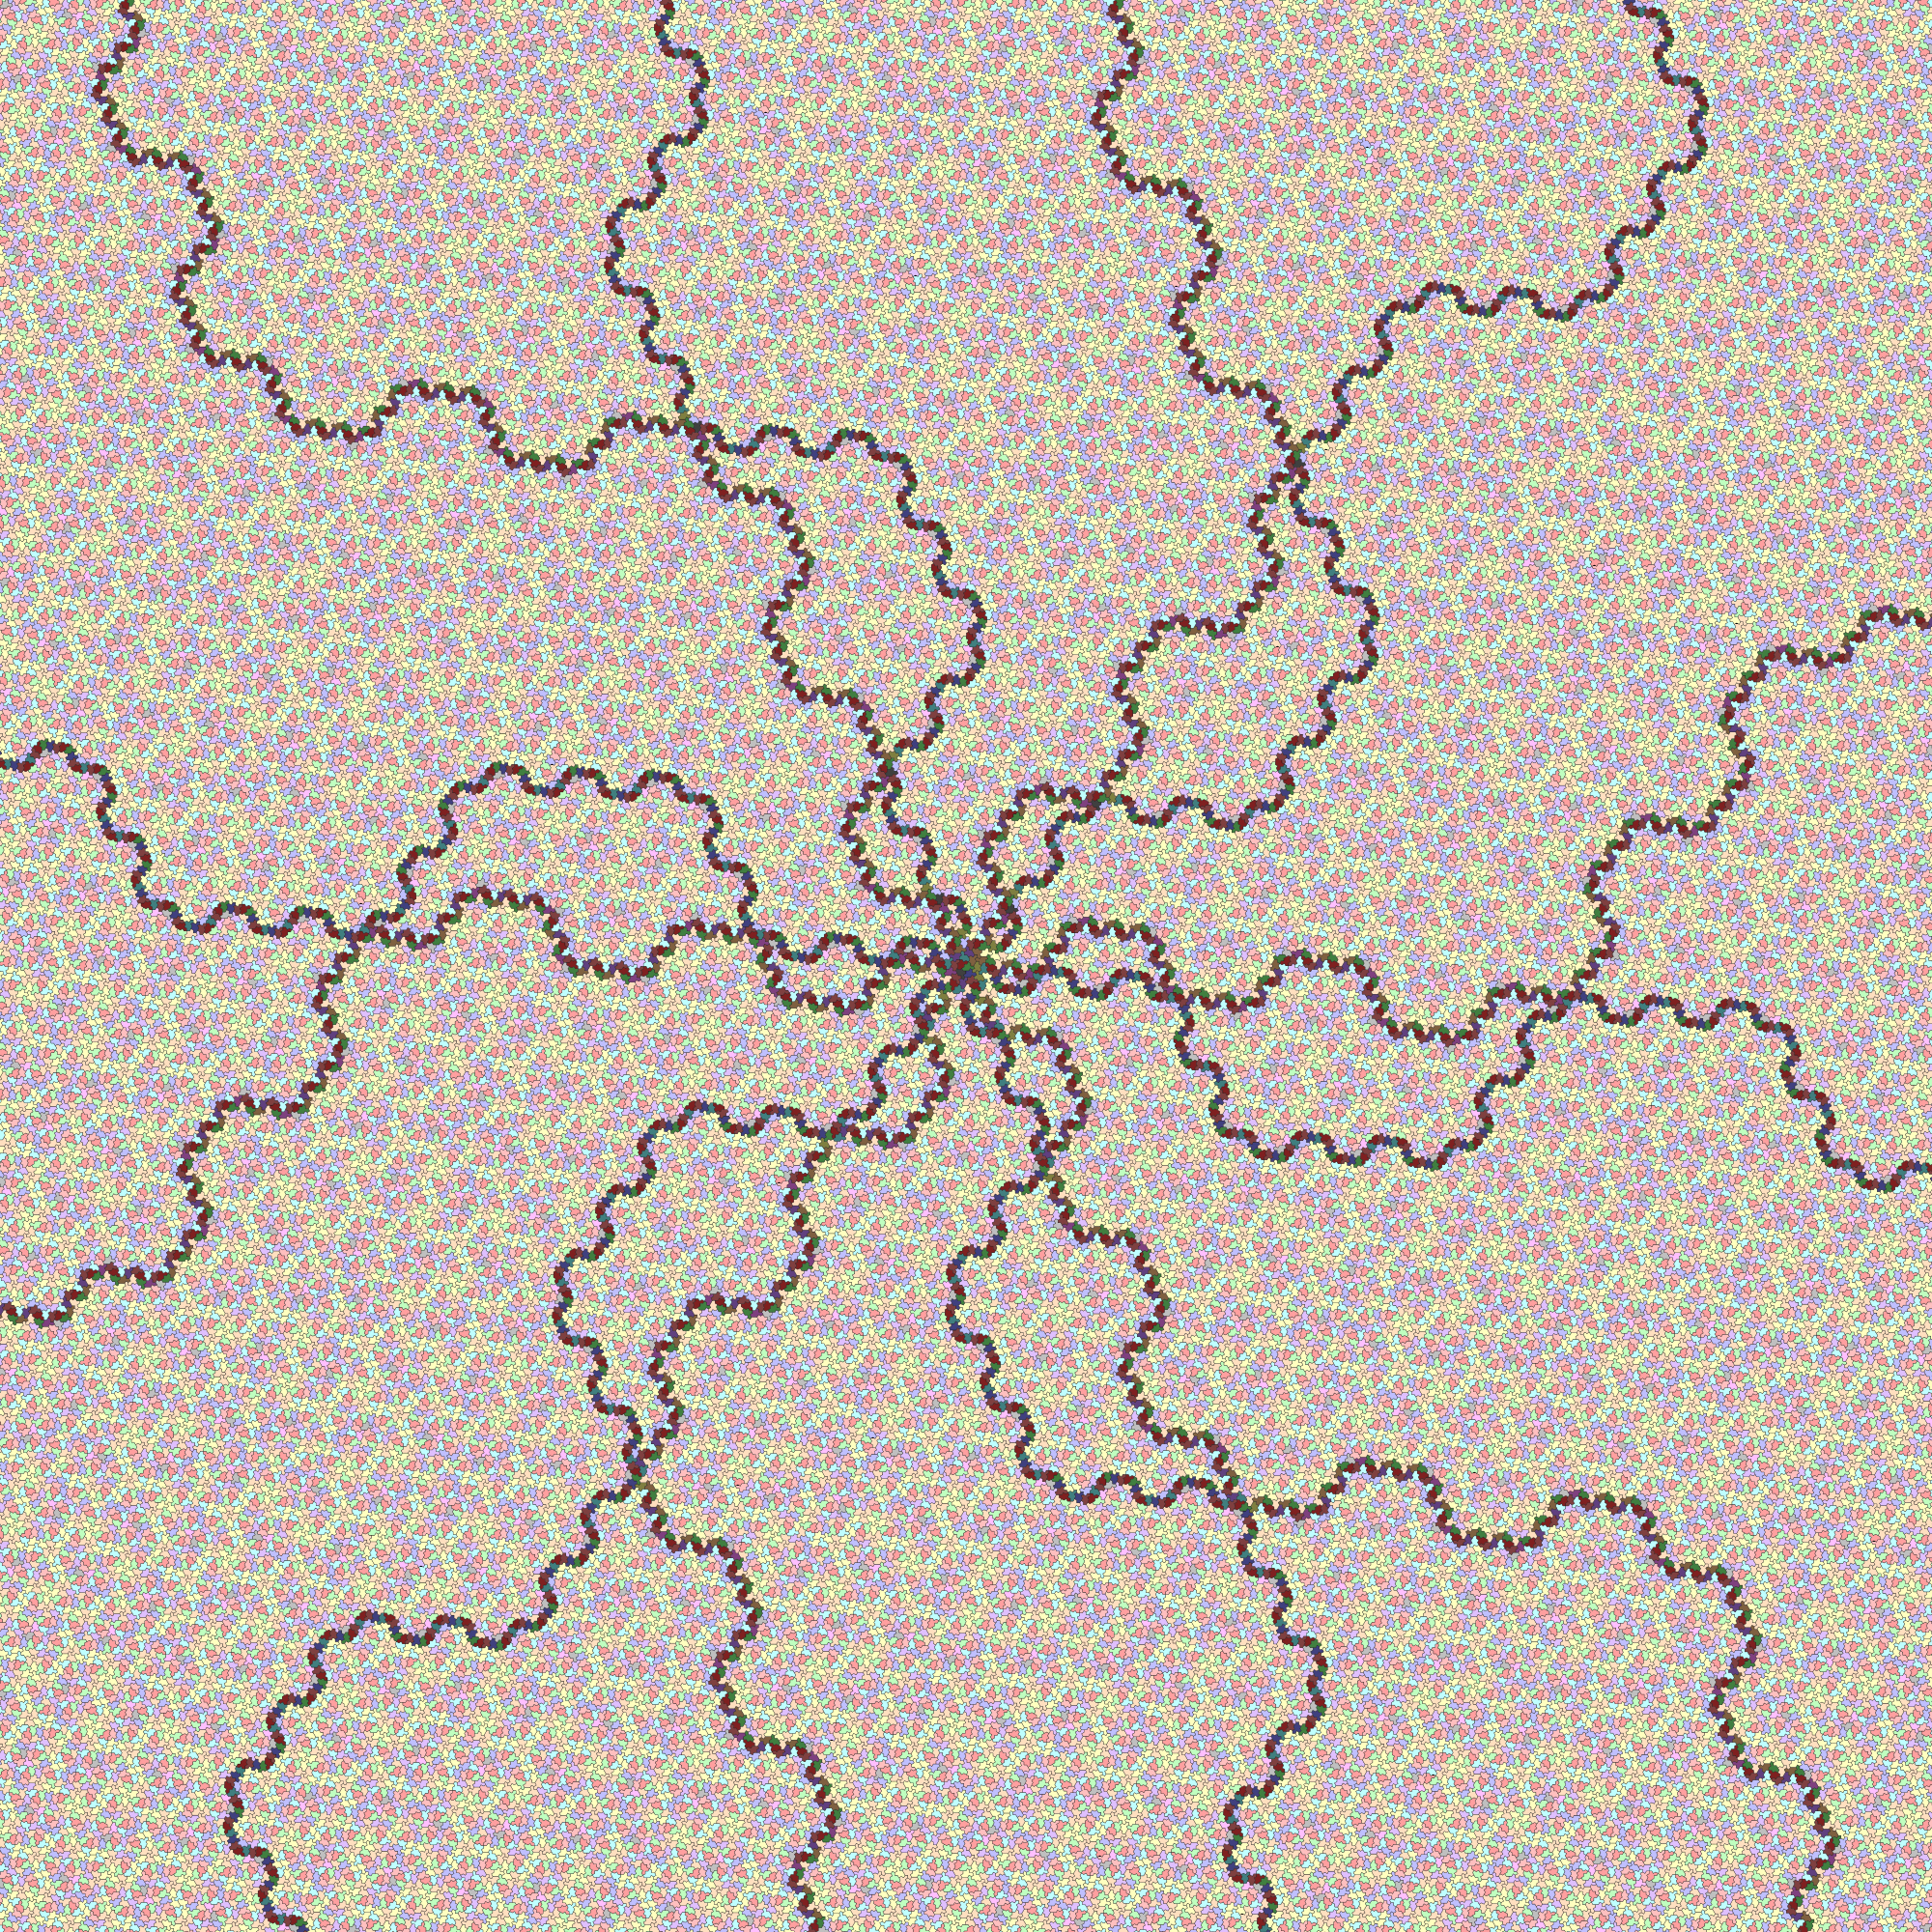
I've recently been rewriting my substitution-tiling transducers code in #RustLang, replacing the old Sage code.Counting the tiles in those two images, the Sage version plotted 1,100 tiles to the Rust version's 60,000. But that's not quite fair to the Rust version.
In order to highlight the asymmetric parts of this particular pattern, you must check for each tile whether all of its five rotations correspond to it. The Sage code did that the easy way, by generating all the tiles once, storing them in a data structure, and then checking for each tile whether its rotational images were also in the data structure.
But the Rust code generates the tiles using a low-memory raster-scan algorithm (mentioned several times in my blog posts and arXiv writeup) which only retains a small number of tile positions in memory. Most tiles it generates are written straight to the SVG output and then forgotten.
In order to highlight the asymmetric parts using _that_ algorithm, you can't check against your existing data structure, because you don't have one. So the Rust code was generating all six rotations of the same pattern _independently_, iterating over them in lockstep like merging six sorted lists, so that when it sees each tile it knows whether it's seeing its five images in the same place. This retains the low-memory property – I could plot far larger versions of this without driving the computer to its knees – but means it has to do six times as much work.
So _really_ the Rust code plotted 360,000 tiles to Sage's 1,100!
-
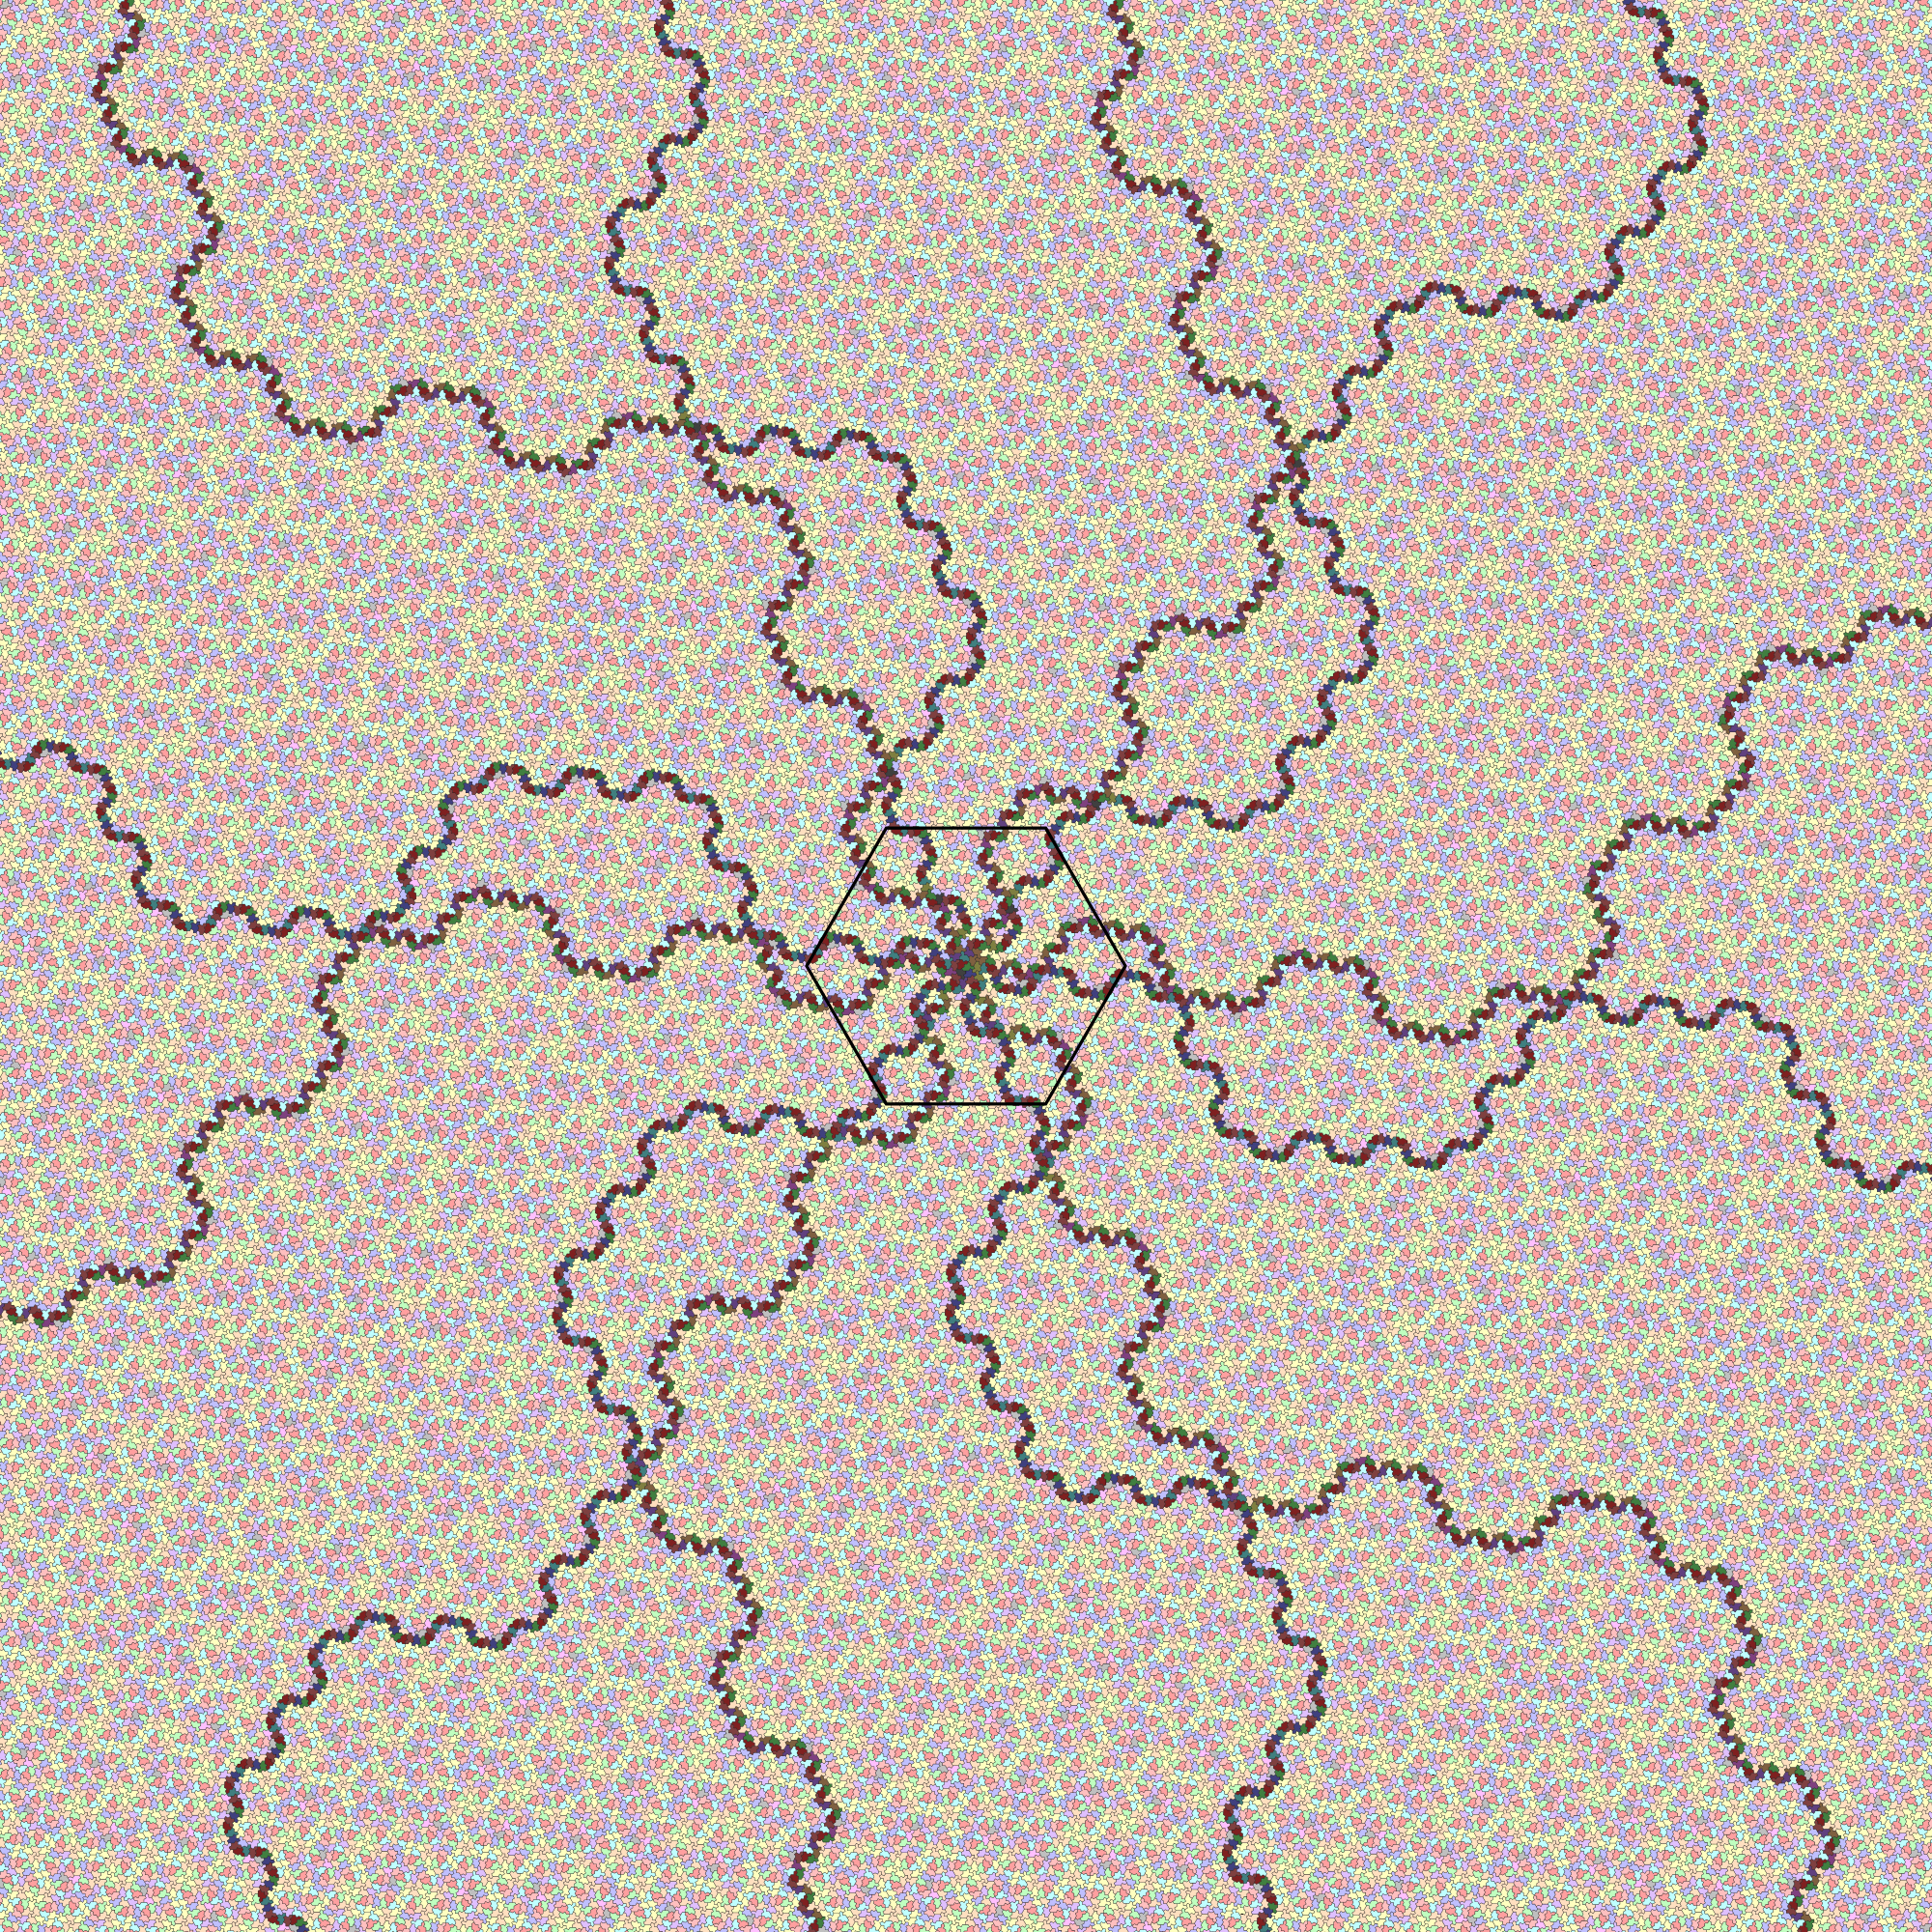
I've recently been rewriting my substitution-tiling transducers code in #RustLang, replacing the old Sage code.Just because I expect someone will appreciate it, here's a pristine version of the larger image, containing just the Spectre tiles, without the hexagon drawn on top.
-
I've recently been rewriting my substitution-tiling transducers code in #RustLang, replacing the old Sage code.I've recently been rewriting my substitution-tiling transducers code in #RustLang, replacing the old Sage code.
One reason is that Sage is harder to run these days. It vanished from Ubuntu some time between 22.04 and 24.04 and hasn't (yet?) come back.
Another reason was that reimplementing all my algorithms from scratch was a valuable exercise in making sure I understood them, when I wrote them up for my arXiv preprint. (Which I'm hoping to produce an improved edition of at some point, filling in some gaps.)
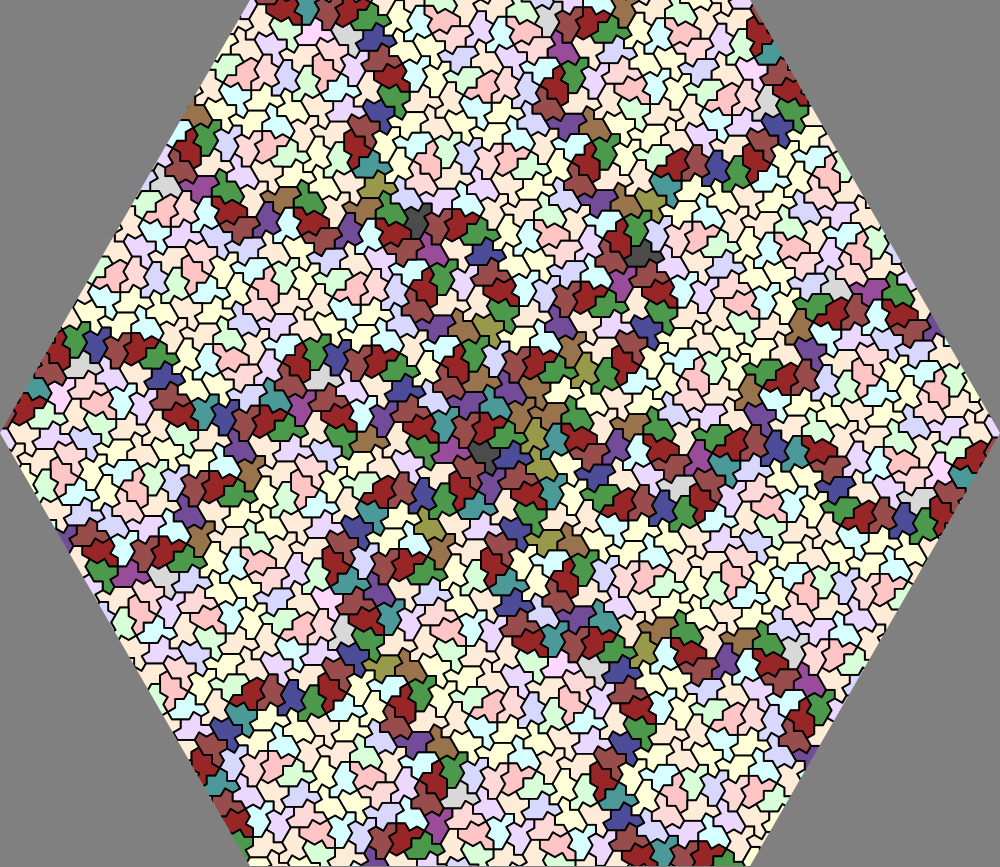
But the third reason is shown in these pictures. The hexagonal one is straight from one of my blog posts, showing the centre of one of the 6-way 'singular' instances of the Spectre tiling. It takes my Sage code 2 minutes in total to generate that SVG.
The second image is the result of the Rust version of the code working for the same 2 minutes. The hexagon marked in the middle shows the boundary of what the Sage code had calculated. Much faster!
-
It's very annoying the way I have to get half way through writing a long detailed explanation of why someone is wrong before I figure out why they're right.It's very annoying the way I have to get half way through writing a long detailed explanation of why someone is wrong before I figure out why they're right.