Skip to content
  • Categories
  • Recent
  • Tags
  • Popular
  • World
  • Users
  • Groups
Skins
  • Light
  • Brite
  • Cerulean
  • Cosmo
  • Flatly
  • Journal
  • Litera
  • Lumen
  • Lux
  • Materia
  • Minty
  • Morph
  • Pulse
  • Sandstone
  • Simplex
  • Sketchy
  • Spacelab
  • United
  • Yeti
  • Zephyr
  • Dark
  • Cyborg
  • Darkly
  • Quartz
  • Slate
  • Solar
  • Superhero
  • Vapor

  • Default (Cyborg)
  • No Skin
Collapse
Brand Logo

CIRCLE WITH A DOT

  1. Home
  2. Uncategorized
  3. When I was in my early twenties I read The Visual Display of Quantitative Information from Tufte and agonized over making charts great for users.

When I was in my early twenties I read The Visual Display of Quantitative Information from Tufte and agonized over making charts great for users.

Scheduled Pinned Locked Moved Uncategorized
91 Posts 70 Posters 1 Views
  • Oldest to Newest
  • Newest to Oldest
  • Most Votes
Reply
  • Reply as topic
Log in to reply
This topic has been deleted. Only users with topic management privileges can see it.
  • riffraff@mastodon.socialR riffraff@mastodon.social

    @nygl @thomasfuchs

    I think it's a haiku and they wanted to stretch the sillable count so they made up a word. It's a mood thing, a-la jabberwocky.

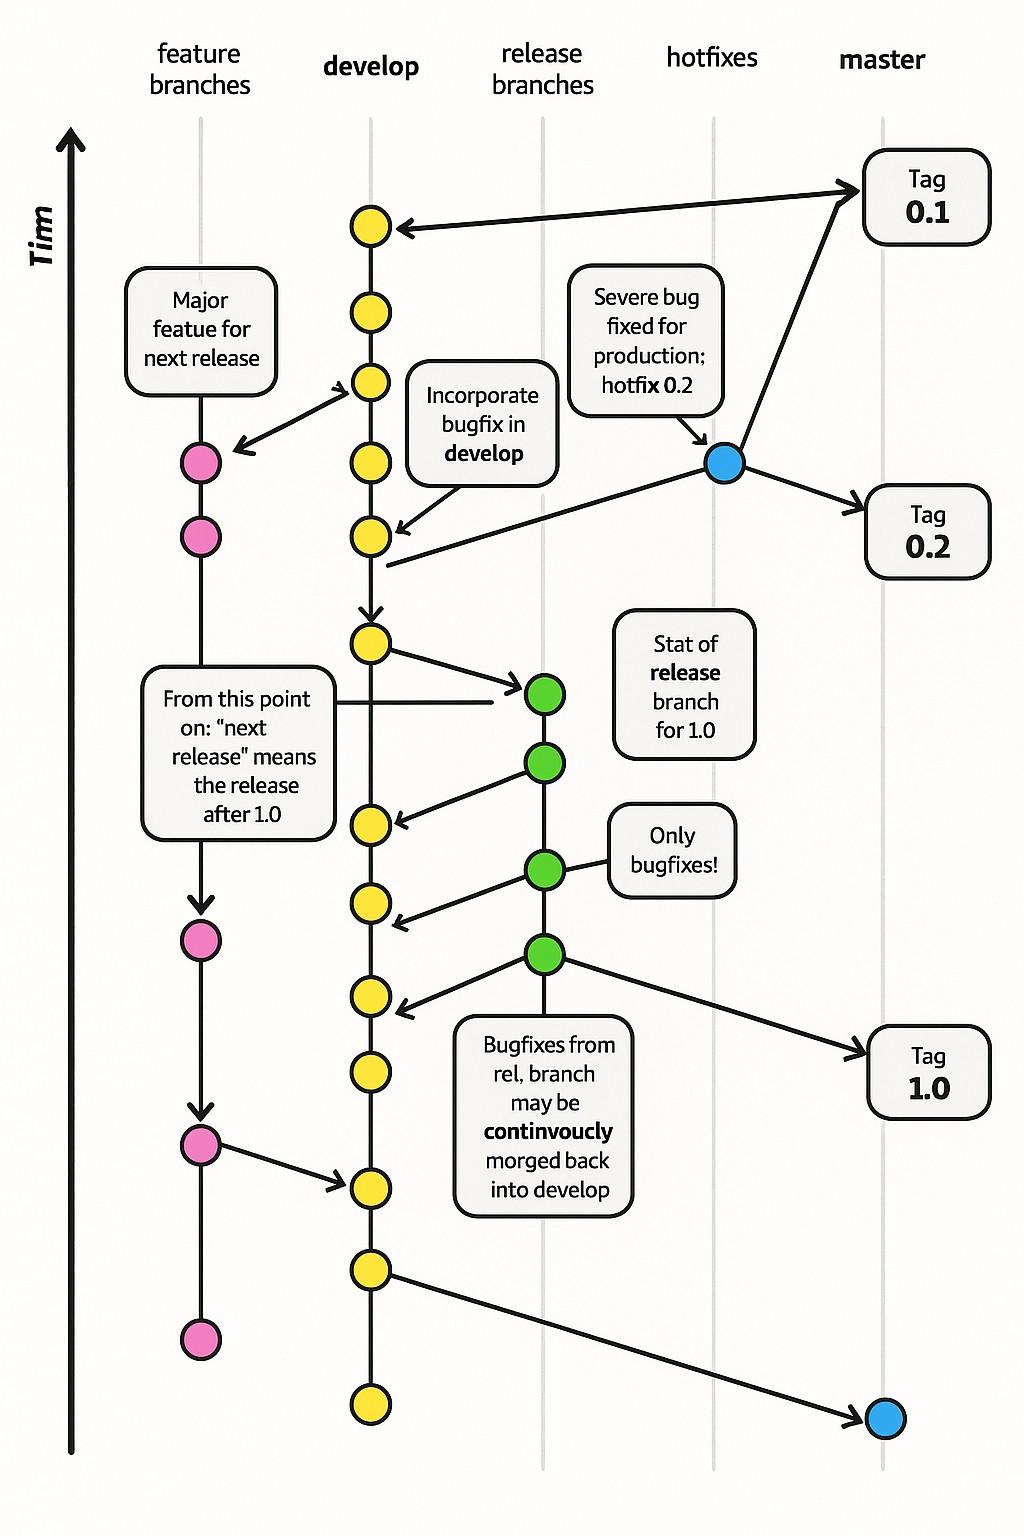
    Bugfix from rel, branch

    Continvoucly morged back

    into development

    smallcircles@social.coopS This user is from outside of this forum
    smallcircles@social.coopS This user is from outside of this forum
    smallcircles@social.coop
    wrote last edited by
    #76

    @riffraff @nygl @thomasfuchs

    All jokes aside continvouclious development is all the rage these days.

    1 Reply Last reply
    0
    • dec23k@mastodon.ieD This user is from outside of this forum
      dec23k@mastodon.ieD This user is from outside of this forum
      dec23k@mastodon.ie
      wrote last edited by
      #77

      @nygl @thomasfuchs
      TIRED: covfefe
      WIRED: continvoucly

      #microslop

      amalia22@mastodon.socialA 1 Reply Last reply
      0
      • groupnebula563@mastodon.socialG groupnebula563@mastodon.social

        @thomasfuchs you know what this reminds me of? i collect random bootleg items and often times they use flavor text stolen from other things, and then retyped manually by people who don't speak english. so you end up with shit like this:

        wcbdata@vis.socialW This user is from outside of this forum
        wcbdata@vis.socialW This user is from outside of this forum
        wcbdata@vis.social
        wrote last edited by
        #78

        @GroupNebula563 @thomasfuchs Ahh yes, the Four Stooges of Britain.

        1 Reply Last reply
        0
        • thomasfuchs@hachyderm.ioT thomasfuchs@hachyderm.io

          When I was in my early twenties I read The Visual Display of Quantitative Information from Tufte and agonized over making charts great for users.

          These days, Microsoft releases graphs like this

          benedictc@mas.toB This user is from outside of this forum
          benedictc@mas.toB This user is from outside of this forum
          benedictc@mas.to
          wrote last edited by
          #79

          @thomasfuchs looks suspiciously similar to this https://jeffkreeftmeijer.com/git-flow/

          Link Preview Image
          1 Reply Last reply
          0
          • thomasfuchs@hachyderm.ioT thomasfuchs@hachyderm.io

            When I was in my early twenties I read The Visual Display of Quantitative Information from Tufte and agonized over making charts great for users.

            These days, Microsoft releases graphs like this

            tripleman@mastodon.socialT This user is from outside of this forum
            tripleman@mastodon.socialT This user is from outside of this forum
            tripleman@mastodon.social
            wrote last edited by
            #80

            @thomasfuchs You're not wrong about this but, I mean, it's Microsoft.

            Stuff that looks like this is their jam.

            1 Reply Last reply
            0
            • thomasfuchs@hachyderm.ioT thomasfuchs@hachyderm.io

              When I was in my early twenties I read The Visual Display of Quantitative Information from Tufte and agonized over making charts great for users.

              These days, Microsoft releases graphs like this

              hackerfriendly@mas.toH This user is from outside of this forum
              hackerfriendly@mas.toH This user is from outside of this forum
              hackerfriendly@mas.to
              wrote last edited by
              #81

              @thomasfuchs@hachyderm.io Bad OCR / image generation fail. It's clearly the git flow method. I think they were trying to morge this: https://nvie.com/posts/a-successful-git-branching-model/

              1 Reply Last reply
              0
              • dec23k@mastodon.ieD dec23k@mastodon.ie

                @nygl @thomasfuchs
                TIRED: covfefe
                WIRED: continvoucly

                #microslop

                amalia22@mastodon.socialA This user is from outside of this forum
                amalia22@mastodon.socialA This user is from outside of this forum
                amalia22@mastodon.social
                wrote last edited by
                #82

                @dec23k @nygl @thomasfuchs 🤣

                1 Reply Last reply
                0
                • mtnrbq65@social.vivaldi.netM mtnrbq65@social.vivaldi.net

                  @thomasfuchs

                  I'm going to be morging my changes back to the develop branch from now on!

                  rytmis@hachyderm.ioR This user is from outside of this forum
                  rytmis@hachyderm.ioR This user is from outside of this forum
                  rytmis@hachyderm.io
                  wrote last edited by
                  #83

                  @mtnrbq65 @thomasfuchs

                  ... but will you do it continvoucly?

                  1 Reply Last reply
                  0
                  • thomasfuchs@hachyderm.ioT thomasfuchs@hachyderm.io

                    When I was in my early twenties I read The Visual Display of Quantitative Information from Tufte and agonized over making charts great for users.

                    These days, Microsoft releases graphs like this

                    jef@mastodon.socialJ This user is from outside of this forum
                    jef@mastodon.socialJ This user is from outside of this forum
                    jef@mastodon.social
                    wrote last edited by
                    #84

                    @thomasfuchs This is a plot diagram of the movie Looper. It did not end well for Timn.

                    1 Reply Last reply
                    0
                    • mark@mastodon.fixermark.comM This user is from outside of this forum
                      mark@mastodon.fixermark.comM This user is from outside of this forum
                      mark@mastodon.fixermark.com
                      wrote last edited by
                      #85

                      @nygl @thomasfuchs My favorite part of software engineering is when I go "it's morgen time" and then morge all those bug fixes back into develop.

                      1 Reply Last reply
                      0
                      • thomasfuchs@hachyderm.ioT thomasfuchs@hachyderm.io

                        When I was in my early twenties I read The Visual Display of Quantitative Information from Tufte and agonized over making charts great for users.

                        These days, Microsoft releases graphs like this

                        thhareau@piaille.frT This user is from outside of this forum
                        thhareau@piaille.frT This user is from outside of this forum
                        thhareau@piaille.fr
                        wrote last edited by
                        #86

                        @thomasfuchs this is stolen from here

                        Link Preview Image
                        A successful Git branching model

                        In this post I present a Git branching strategy for developing and releasing software as I’ve used it in many of my projects, and which has turned out to be very successful.

                        favicon

                        nvie.com (nvie.com)

                        It has nothing to do with AI, it was created by a human in 2010.

                        thomasfuchs@hachyderm.ioT 1 Reply Last reply
                        0
                        • thhareau@piaille.frT thhareau@piaille.fr

                          @thomasfuchs this is stolen from here

                          Link Preview Image
                          A successful Git branching model

                          In this post I present a Git branching strategy for developing and releasing software as I’ve used it in many of my projects, and which has turned out to be very successful.

                          favicon

                          nvie.com (nvie.com)

                          It has nothing to do with AI, it was created by a human in 2010.

                          thomasfuchs@hachyderm.ioT This user is from outside of this forum
                          thomasfuchs@hachyderm.ioT This user is from outside of this forum
                          thomasfuchs@hachyderm.io
                          wrote last edited by
                          #87

                          @thhareau have you read the labels on Microsoft’s chart?

                          thhareau@piaille.frT 1 Reply Last reply
                          0
                          • thomasfuchs@hachyderm.ioT thomasfuchs@hachyderm.io

                            @thhareau have you read the labels on Microsoft’s chart?

                            thhareau@piaille.frT This user is from outside of this forum
                            thhareau@piaille.frT This user is from outside of this forum
                            thhareau@piaille.fr
                            wrote last edited by
                            #88

                            @thomasfuchs true! So weird...

                            It's funny to think that nvie is saying in his Note of Reflection that such a model should not be used anymore

                            1 Reply Last reply
                            0
                            • novemdecimal@sunny.gardenN novemdecimal@sunny.garden

                              @thomasfuchs

                              I have so many question right now.

                              Did... anyone at Microsoft approve this chart? How come they didn't notice so many glaring errors that produced by AI?

                              masto@masto.masto.comM This user is from outside of this forum
                              masto@masto.masto.comM This user is from outside of this forum
                              masto@masto.masto.com
                              wrote last edited by
                              #89

                              @NovemDecimal @thomasfuchs You may be lucky enough not to work in corporate tech. I say without exaggeration that nobody any longer does any work or thinking at work. 100% of documents, slide decks, charts, slack posts, code, code reviews, etc. are AI generated. In many cases this is mandatory.

                              1 Reply Last reply
                              0
                              • thomasfuchs@hachyderm.ioT thomasfuchs@hachyderm.io

                                When I was in my early twenties I read The Visual Display of Quantitative Information from Tufte and agonized over making charts great for users.

                                These days, Microsoft releases graphs like this

                                toadjaune@hostux.socialT This user is from outside of this forum
                                toadjaune@hostux.socialT This user is from outside of this forum
                                toadjaune@hostux.social
                                wrote last edited by
                                #90

                                @thomasfuchs Reading this graph went like this in my mind :

                                - I don't see what the fuss is about, this looks like a pretty classic git flow
                                [...]
                                - Wait, wat ?
                                [...]
                                - Oh no
                                [...]
                                - Oh no
                                [...]
                                - Oh no

                                And the more you look at it, the worse it gets

                                1 Reply Last reply
                                0
                                • thomasfuchs@hachyderm.ioT thomasfuchs@hachyderm.io

                                  When I was in my early twenties I read The Visual Display of Quantitative Information from Tufte and agonized over making charts great for users.

                                  These days, Microsoft releases graphs like this

                                  jwb@sfba.socialJ This user is from outside of this forum
                                  jwb@sfba.socialJ This user is from outside of this forum
                                  jwb@sfba.social
                                  wrote last edited by
                                  #91

                                  @thomasfuchs can we also speak about how only an idiot would develop with this flow? Let's ignore the deepdream chart. Even if they had managed to communicate this idea clearly, the idea itself is badly flawed! The hotfix never gets released. Also, the only people I've met who would use the word "hotfix" were all dangerously stupid people.

                                  1 Reply Last reply
                                  0
                                  Reply
                                  • Reply as topic
                                  Log in to reply
                                  • Oldest to Newest
                                  • Newest to Oldest
                                  • Most Votes


                                  • Login

                                  • Login or register to search.
                                  • First post
                                    Last post
                                  0
                                  • Categories
                                  • Recent
                                  • Tags
                                  • Popular
                                  • World
                                  • Users
                                  • Groups