When I was in my early twenties I read The Visual Display of Quantitative Information from Tufte and agonized over making charts great for users.
-
When I was in my early twenties I read The Visual Display of Quantitative Information from Tufte and agonized over making charts great for users.
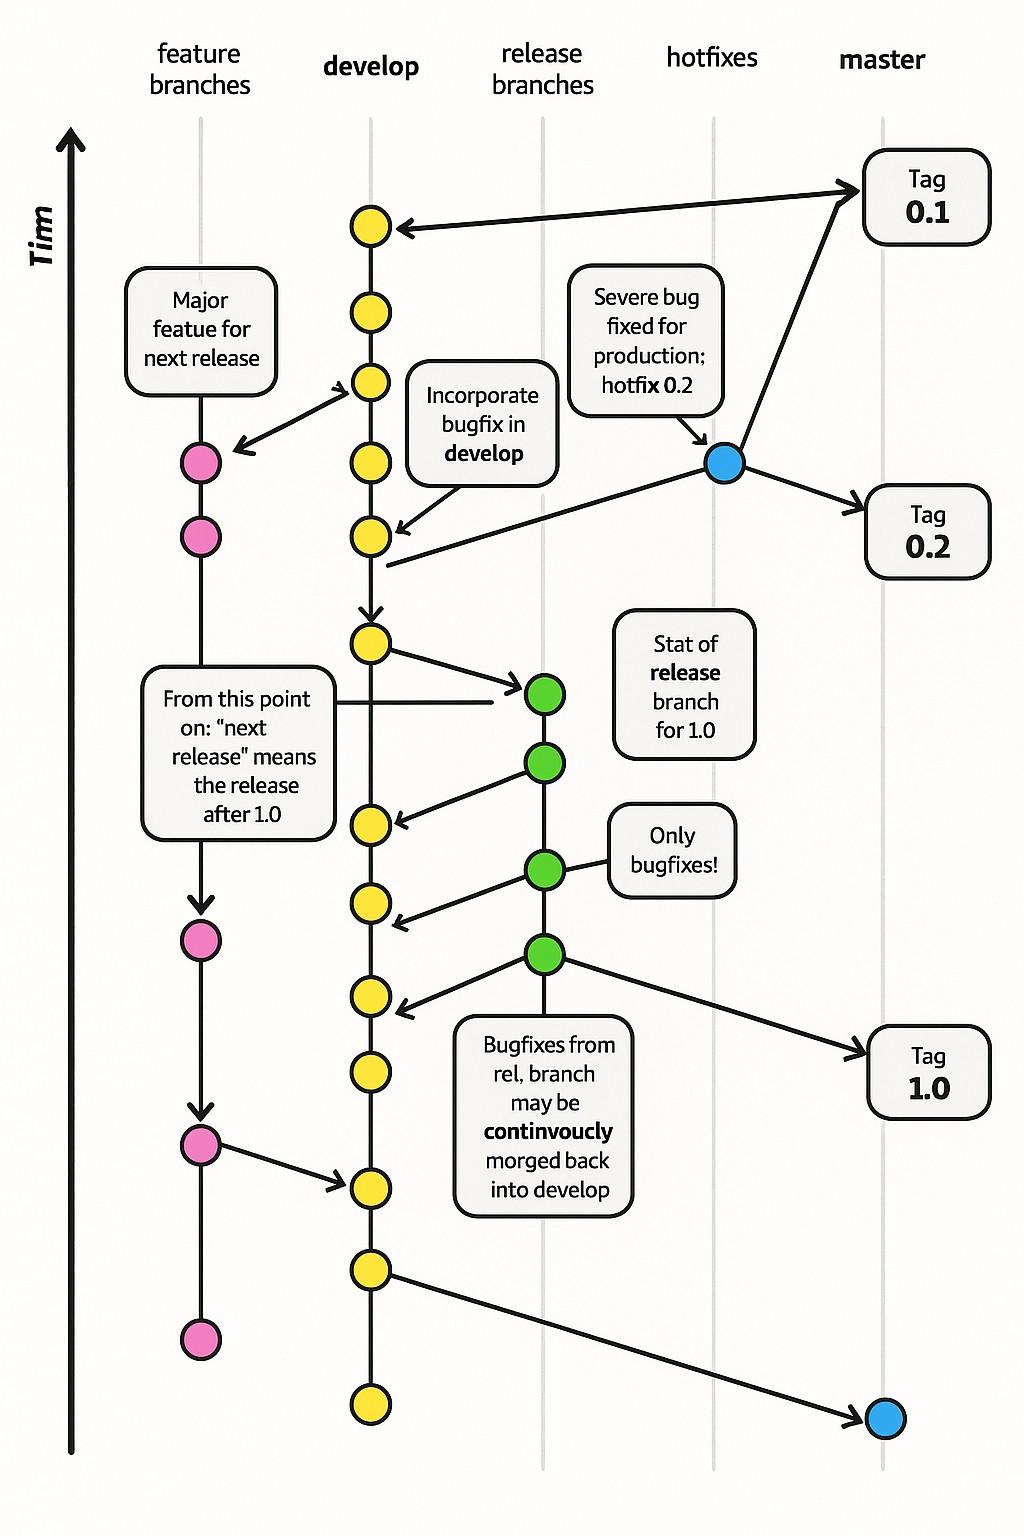
These days, Microsoft releases graphs like this
@thomasfuchs When did they release this? And what's Tim up to? I guess he's past the top of the chart? I have enough trouble understanding these when they are well formatted, but um, what's Tim doing up, and arrows pointing down?
-
When I was in my early twenties I read The Visual Display of Quantitative Information from Tufte and agonized over making charts great for users.
These days, Microsoft releases graphs like this
@thomasfuchs even gitflow is too complicated for most projects, and that doesn't even involve morging
-
When I was in my early twenties I read The Visual Display of Quantitative Information from Tufte and agonized over making charts great for users.
These days, Microsoft releases graphs like this
@thomasfuchs I've always wondered how plumbuses were made
-
When I was in my early twenties I read The Visual Display of Quantitative Information from Tufte and agonized over making charts great for users.
These days, Microsoft releases graphs like this
@thomasfuchs yeah.... we think it's like fashion, people who see it may appreciate it in passing but it's only really worth the effort if it also makes us happy to do
-
@thomasfuchs yeah.... we think it's like fashion, people who see it may appreciate it in passing but it's only really worth the effort if it also makes us happy to do
@thomasfuchs since clearly it isn't going to be rewarded in conventional ways, heh sigh
-
I think it's a haiku and they wanted to stretch the sillable count so they made up a word. It's a mood thing, a-la jabberwocky.
Bugfix from rel, branch
Continvoucly morged back
into development
-
@thomasfuchs what is Tim doing on the left side?
@jal @thomasfuchs he is contivoucly morging.
-
@thomasfuchs What letter is that?

@bplein @thomasfuchs as you can see, Tirm is the time traveler going back in the git history.
-
@thomasfuchs first time I committed the feedback form over there. Like really, wtf‽ Hopefully it will be read by an actual person not another stupid micro$lop AI agent.
-
Backwards timn
@elithebearded @lmorchard @thomasfuchs from rnicrosoft we learned that his name is Tirm
-
When I was in my early twenties I read The Visual Display of Quantitative Information from Tufte and agonized over making charts great for users.
These days, Microsoft releases graphs like this
@thomasfuchs if I were @nvie I'd partner up with an attorney specialised in copyright and sue the f**k out of them
-
When I was in my early twenties I read The Visual Display of Quantitative Information from Tufte and agonized over making charts great for users.
These days, Microsoft releases graphs like this
@thomasfuchs appears to have been silently replaced within the last ~10 minutes, i just opened the page again to grab a screenshot and there's a new diagram where that one was
-
@elithebearded @lmorchard @thomasfuchs from rnicrosoft we learned that his name is Tirm
@gunstick @elithebearded @lmorchard @thomasfuchs I believe it was Dorian Gray who invented the "timn-sequence diagram" we all use today.
#DorianGray #timn #uml -
When I was in my early twenties I read The Visual Display of Quantitative Information from Tufte and agonized over making charts great for users.
These days, Microsoft releases graphs like this
I'm going to be morging my changes back to the develop branch from now on!
-
@gunstick @elithebearded @lmorchard @thomasfuchs I believe it was Dorian Gray who invented the "timn-sequence diagram" we all use today.
#DorianGray #timn #uml@gunstick @elithebearded @lmorchard @thomasfuchs
Great, now because of you lot they deleted timn and the world will never learn. The irony of changing the docs about versioning flows without documenting the change is delicious. Almost as delicious as the fact that archive.org exists.
To save you the time: https://web.archive.org/web/20260217061031/https://learn.microsoft.com/en-us/training/modules/introduction-to-github/3-components-of-github-flow -
When I was in my early twenties I read The Visual Display of Quantitative Information from Tufte and agonized over making charts great for users.
These days, Microsoft releases graphs like this
"What do you call yourselves?"
"The Aristocrats" -
@thomasfuchs appears to have been silently replaced within the last ~10 minutes, i just opened the page again to grab a screenshot and there's a new diagram where that one was
-
When I was in my early twenties I read The Visual Display of Quantitative Information from Tufte and agonized over making charts great for users.
These days, Microsoft releases graphs like this
@thomasfuchs Does the existence of pictures like this indicate how most people never try to read and understand charts?
When this exists, they will never learn that it's worth making the effort

-
@bplein If you're lost, you can look and you will find me
Timn after Timn@thomasfuchs @bplein There should be a passionate Karaoke over this
-
When I was in my early twenties I read The Visual Display of Quantitative Information from Tufte and agonized over making charts great for users.
These days, Microsoft releases graphs like this
@thomasfuchs what the actual fuck is that! rhetorical question of course, we all know what it is, it is a pile of crap.
