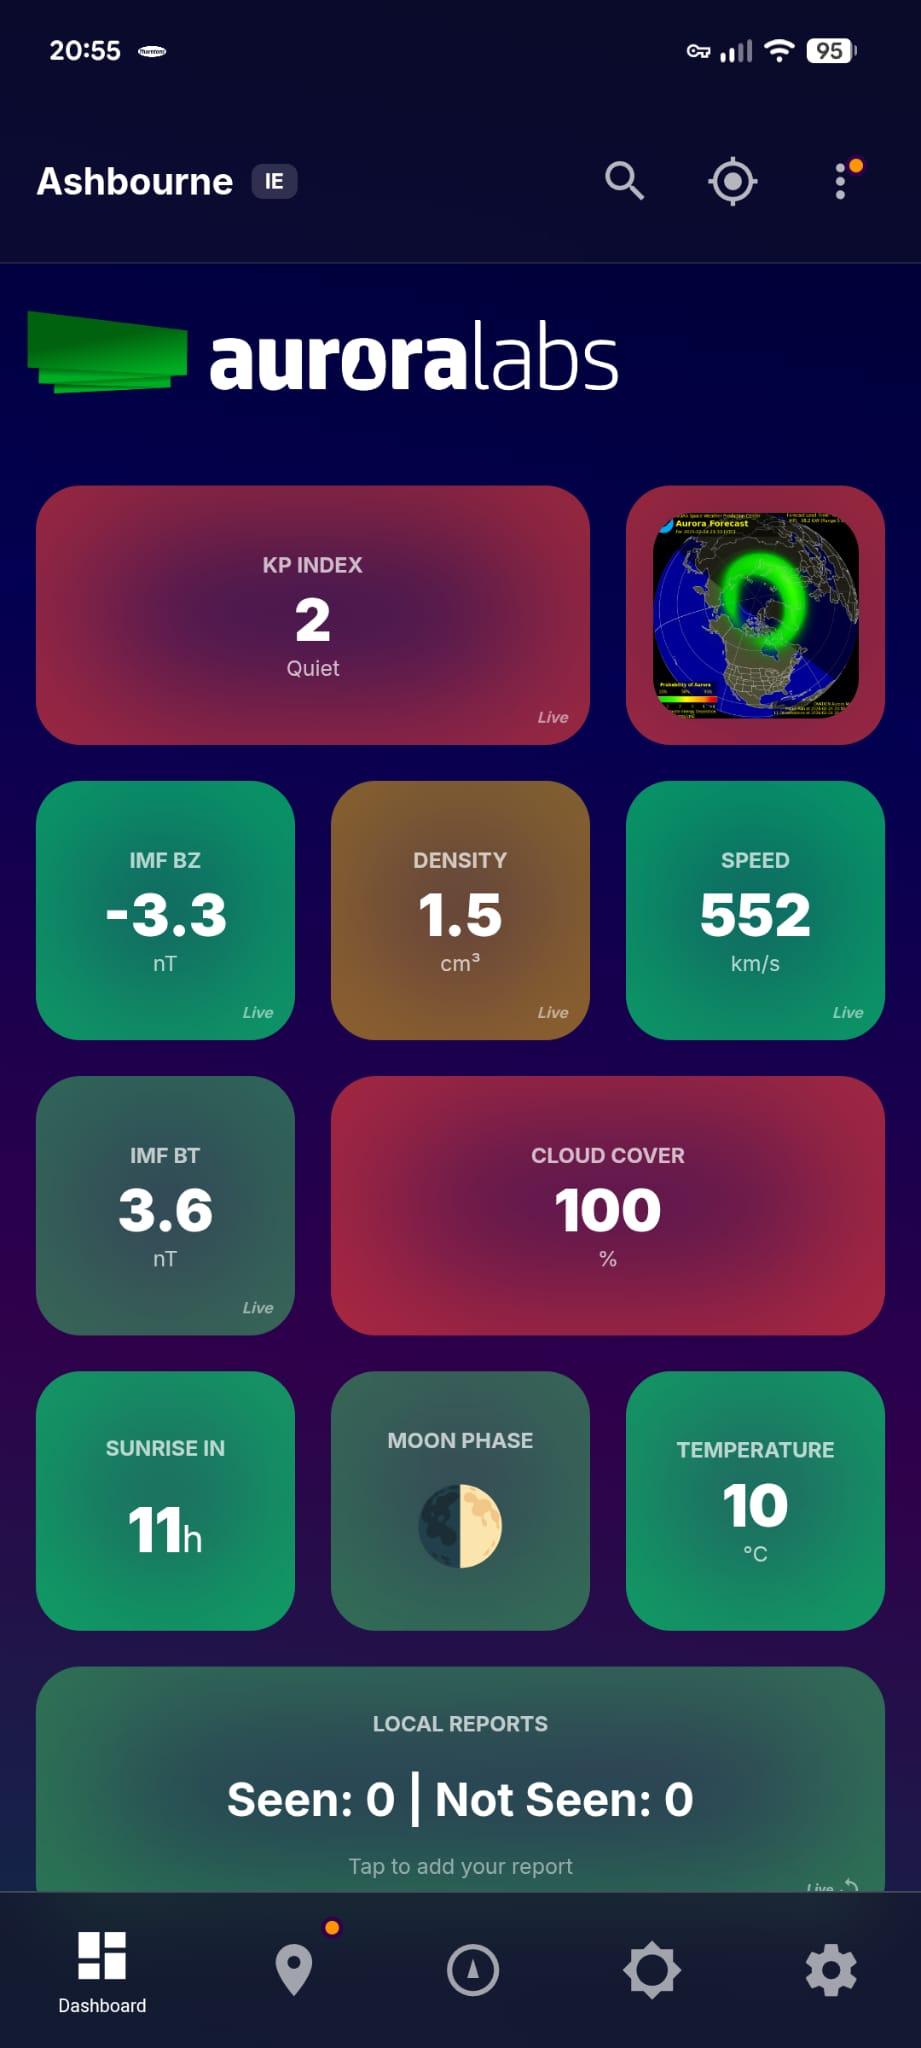
teaser for my little winter project.

-
@ross only concern is would it respond to theme changes? maybe a redraw hook and it will be ok?
-
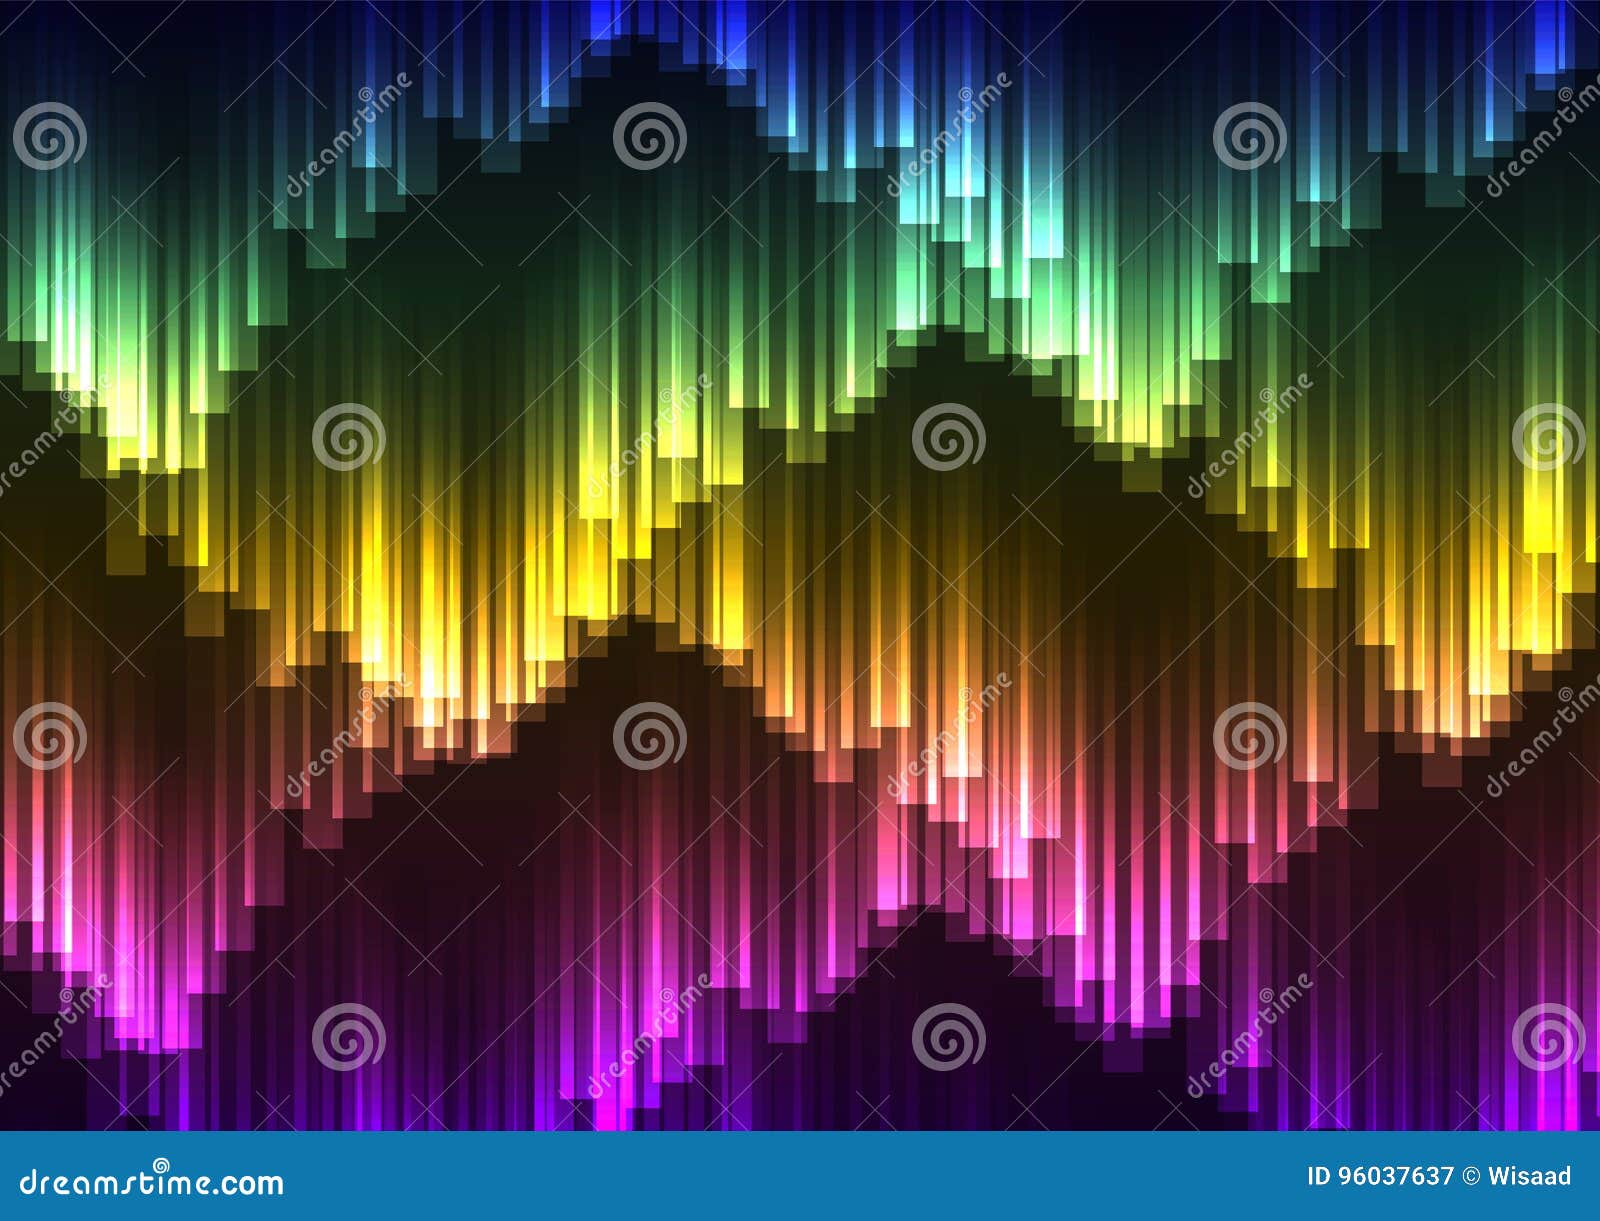
boom. bar charts.

just using a GtkFrame and styling with CSS.
the line graph will be trickier, but thinking about generating an SVG and displaying that.
#linux #opensource #gnome #gtk #libadwaita #design #aurora

@hbons I'm thinking it would be really neat if you where able to give those charts some sort of color fade, so that they look like auroras… !?
-
@hbons I'm thinking it would be really neat if you where able to give those charts some sort of color fade, so that they look like auroras… !?
@forteller yes! that's the plan. thanks for the inspiration.
")
-
@forteller yes! that's the plan. thanks for the inspiration.
@hbons Awesome!

-
boom. bar charts.
just using a GtkFrame and styling with CSS.
the line graph will be trickier, but thinking about generating an SVG and displaying that.
#linux #opensource #gnome #gtk #libadwaita #design #aurora
TIL about GtkLevelBar.
GtkProgressBar's lost brother from an other mother.
just set the min/max and a value. convenient!
#linux #opensource #gnome #gtk #libadwaita #design #aurora

-
TIL about GtkLevelBar.
GtkProgressBar's lost brother from an other mother.
just set the min/max and a value. convenient!
#linux #opensource #gnome #gtk #libadwaita #design #aurora
#libadwaita has a handy .accent CSS class for labels.
using that (+bold) to highlight when measurements are good or heading in the right direction.
#linux #opensource #gnome #gtk #libadwaita #design #aurora

-
the NOAA space weather data does not have an API. it's a bunch of undocumented random .json files behind a CDN that sometimes partially cuts cached files.
so I wanted to have something reliable to work with first.
it's... interesting for an official government agency... 🤨
@hbons when I was building my TUI hamclock this infuriated me to no end. Most every site in US gov has somewhat decently documented API for their services. NOAA? Nah.
I feel like I should be grateful there's even the .json files since so much of it is probably still teletype driven.
-
@hbons when I was building my TUI hamclock this infuriated me to no end. Most every site in US gov has somewhat decently documented API for their services. NOAA? Nah.
I feel like I should be grateful there's even the .json files since so much of it is probably still teletype driven.
@skatterbean the story of technical engineering.
designing the sensors, putting them on a satellite on top of a rocket and launching it into space in a stable position between the Earth and Sun, beaming the data back: no problemo.

formatting and documenting the data for human consumption. nah that’s too hard.

-
#libadwaita has a handy .accent CSS class for labels.
using that (+bold) to highlight when measurements are good or heading in the right direction.
#linux #opensource #gnome #gtk #libadwaita #design #aurora
-
just hardcoding European cities for now as I don't have location support yet for the first release.
sorry non-Europeans, your day will come.
-
it needs an icon of some kind for balance... too much text.

-
@hbons This makes me wonder if anyone has done something similar for Home Assistant... I'll have to go digging later.
-
@hbons This makes me wonder if anyone has done something similar for Home Assistant... I'll have to go digging later.
@Lynx yes! someone in this thread replied with a link.
-
it needs an icon of some kind for balance... too much text.
@hbons Is there a way to show some kind of a simple graph? Like, perhaps percentages over the next couple hours? Or some kind of indicator of how likely things are now?
(General weather apps might probably be good inspirations.)
-
just hardcoding European cities for now as I don't have location support yet for the first release.
sorry non-Europeans, your day will come.
@hbons can we already get this somewhere? I'd love to try it out
-
@hbons can we already get this somewhere? I'd love to try it out
@blackwolf12333 needs another week or 2. then I’ll have some flatpak CI builds for testing.
-
@hbons Is there a way to show some kind of a simple graph? Like, perhaps percentages over the next couple hours? Or some kind of indicator of how likely things are now?
(General weather apps might probably be good inspirations.)
-
@scottishwildcat @garrett that's much better than the most installed iOS one!
-
@scottishwildcat @garrett that's much better than the most installed iOS one!
-
@scottishwildcat @garrett there’s only one source for the data. it’s literally a matter of presentation and interpretation.