I have finished the temperature blanket panel for 2025!
-
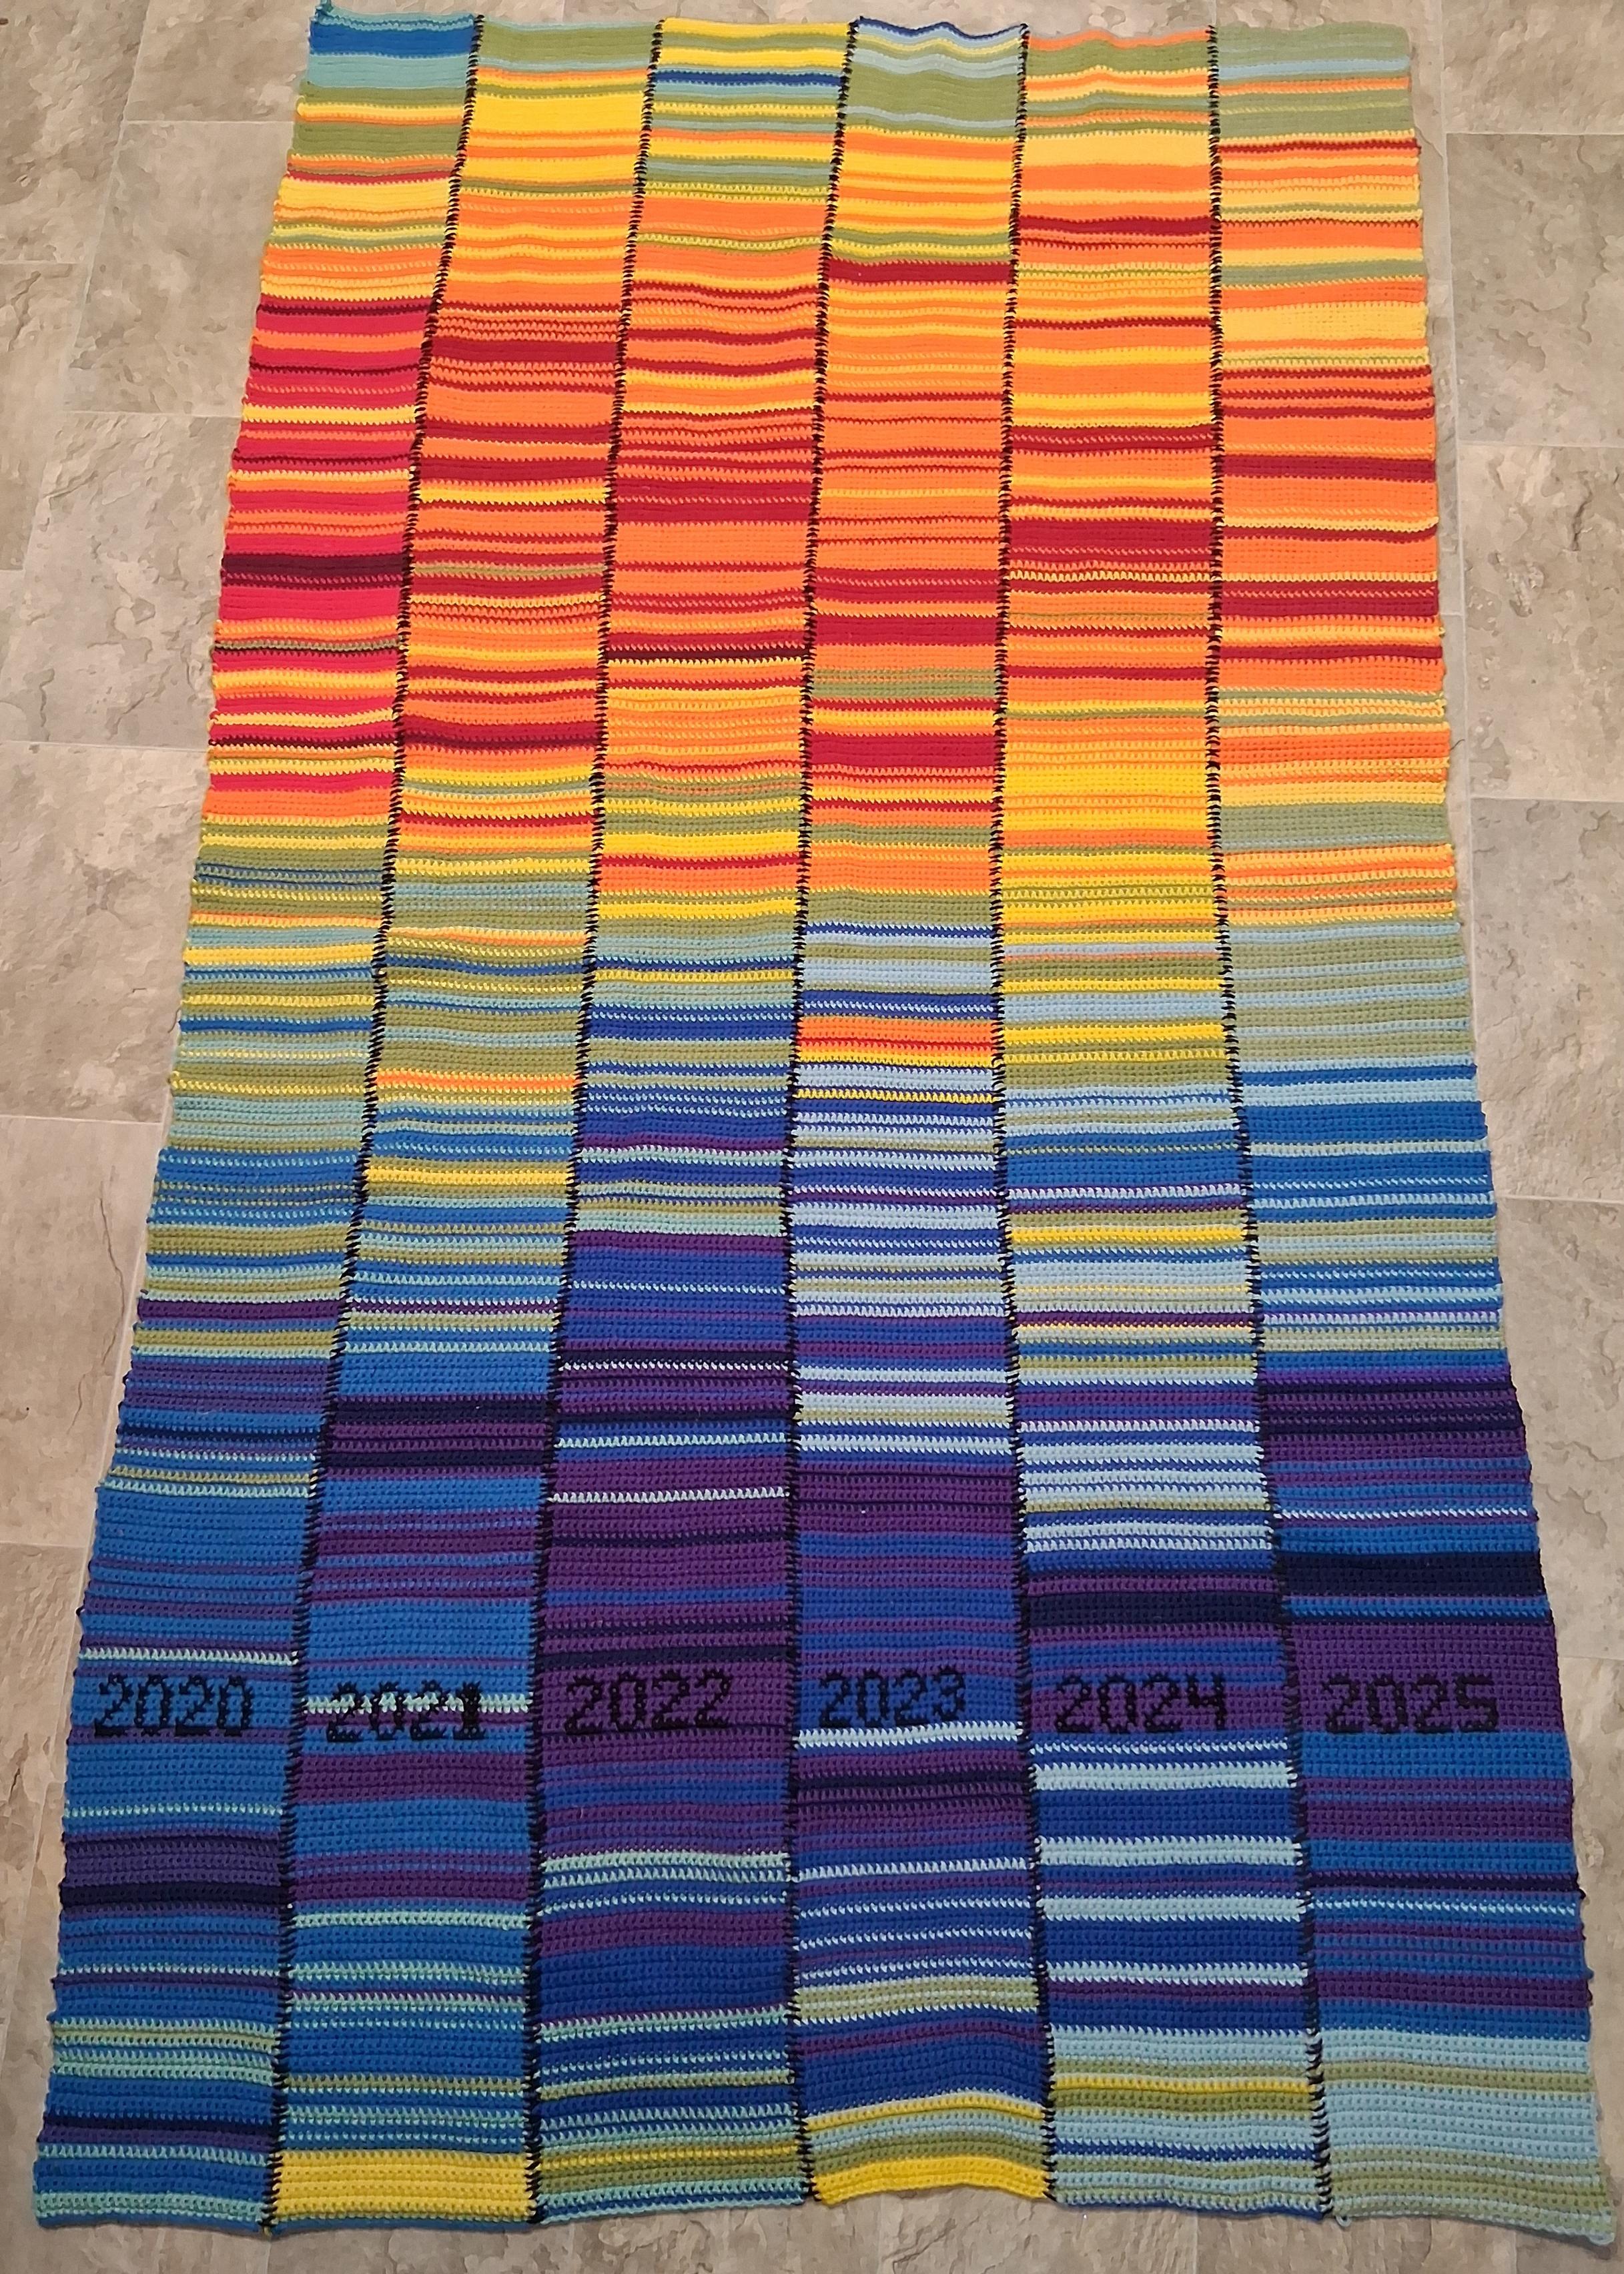
I have finished the temperature blanket panel for 2025! This is a decade-long project. Each stripe represents the local daily high temperature in farenheit: red is 90s, orange is 80s, yellow is 70s, and so on.
To capture the entire winter and summer seasons, the first bottom row actually starts on November 1st of the previous year, and the numbers are placed on January 1st of the labeled year, and it continues up from there.
#crochet #FiberArt #ClimateDiary
-
I have finished the temperature blanket panel for 2025! This is a decade-long project. Each stripe represents the local daily high temperature in farenheit: red is 90s, orange is 80s, yellow is 70s, and so on.
To capture the entire winter and summer seasons, the first bottom row actually starts on November 1st of the previous year, and the numbers are placed on January 1st of the labeled year, and it continues up from there.
#crochet #FiberArt #ClimateDiary
@Cat_LeFey
Bravo! What an awesome project. Thanks for sharing. -
R relay@relay.infosec.exchange shared this topic
-
I have finished the temperature blanket panel for 2025! This is a decade-long project. Each stripe represents the local daily high temperature in farenheit: red is 90s, orange is 80s, yellow is 70s, and so on.
To capture the entire winter and summer seasons, the first bottom row actually starts on November 1st of the previous year, and the numbers are placed on January 1st of the labeled year, and it continues up from there.
#crochet #FiberArt #ClimateDiary
@Cat_LeFey Wauw, that is awesome
 !
! -
I have finished the temperature blanket panel for 2025! This is a decade-long project. Each stripe represents the local daily high temperature in farenheit: red is 90s, orange is 80s, yellow is 70s, and so on.
To capture the entire winter and summer seasons, the first bottom row actually starts on November 1st of the previous year, and the numbers are placed on January 1st of the labeled year, and it continues up from there.
#crochet #FiberArt #ClimateDiary
@Cat_LeFey gorgeous! 🤩
-
I have finished the temperature blanket panel for 2025! This is a decade-long project. Each stripe represents the local daily high temperature in farenheit: red is 90s, orange is 80s, yellow is 70s, and so on.
To capture the entire winter and summer seasons, the first bottom row actually starts on November 1st of the previous year, and the numbers are placed on January 1st of the labeled year, and it continues up from there.
#crochet #FiberArt #ClimateDiary
This is stunning!
Could I ask about your coloura and how they link to temperatures please?
Did you have a set colour for certain temperature ranges?
-
I have finished the temperature blanket panel for 2025! This is a decade-long project. Each stripe represents the local daily high temperature in farenheit: red is 90s, orange is 80s, yellow is 70s, and so on.
To capture the entire winter and summer seasons, the first bottom row actually starts on November 1st of the previous year, and the numbers are placed on January 1st of the labeled year, and it continues up from there.
#crochet #FiberArt #ClimateDiary
@Cat_LeFey @at this is great both as fibre art and as citizen science!
-
R relay@relay.an.exchange shared this topic
-
I have finished the temperature blanket panel for 2025! This is a decade-long project. Each stripe represents the local daily high temperature in farenheit: red is 90s, orange is 80s, yellow is 70s, and so on.
To capture the entire winter and summer seasons, the first bottom row actually starts on November 1st of the previous year, and the numbers are placed on January 1st of the labeled year, and it continues up from there.
#crochet #FiberArt #ClimateDiary
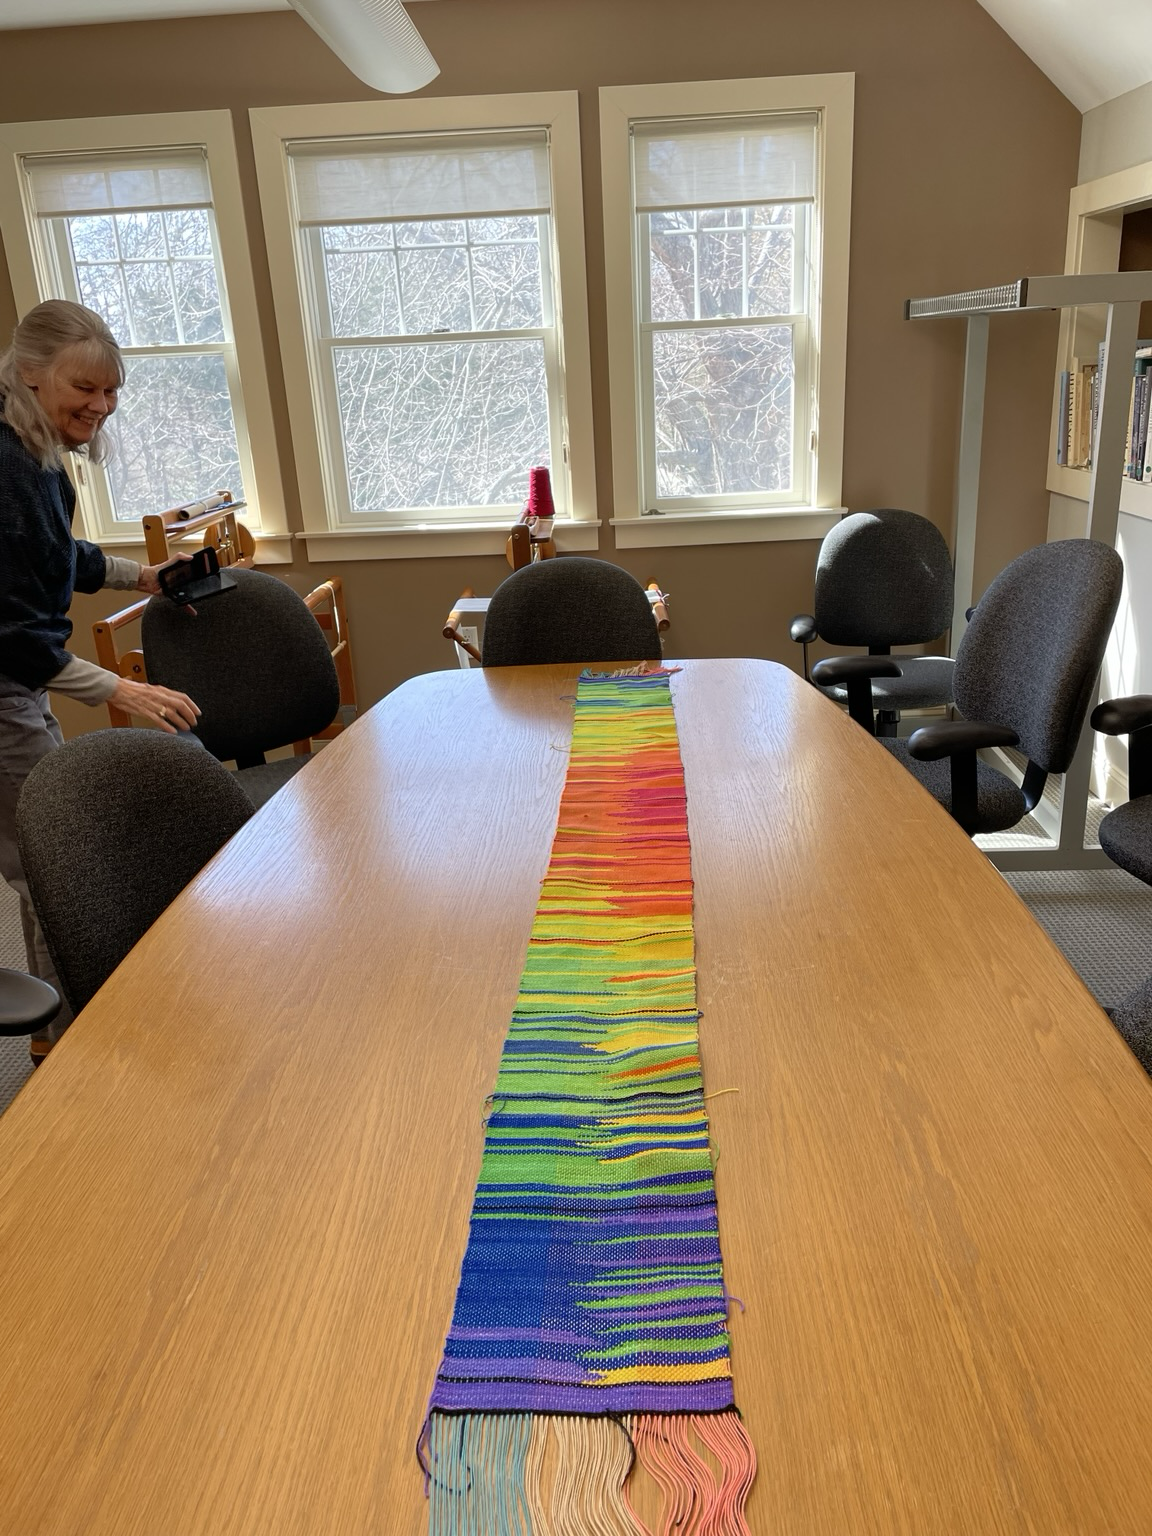
@Cat_LeFey My personal climate scarf—One side is daily Philadelphia temperatures in the year I was born (1956) and the other is Philly temps in 2021 when I made the scarf.
-
R relay@relay.mycrowd.ca shared this topic