Hi, it's me, from the "BloombergNEF" cited in that chart.
-
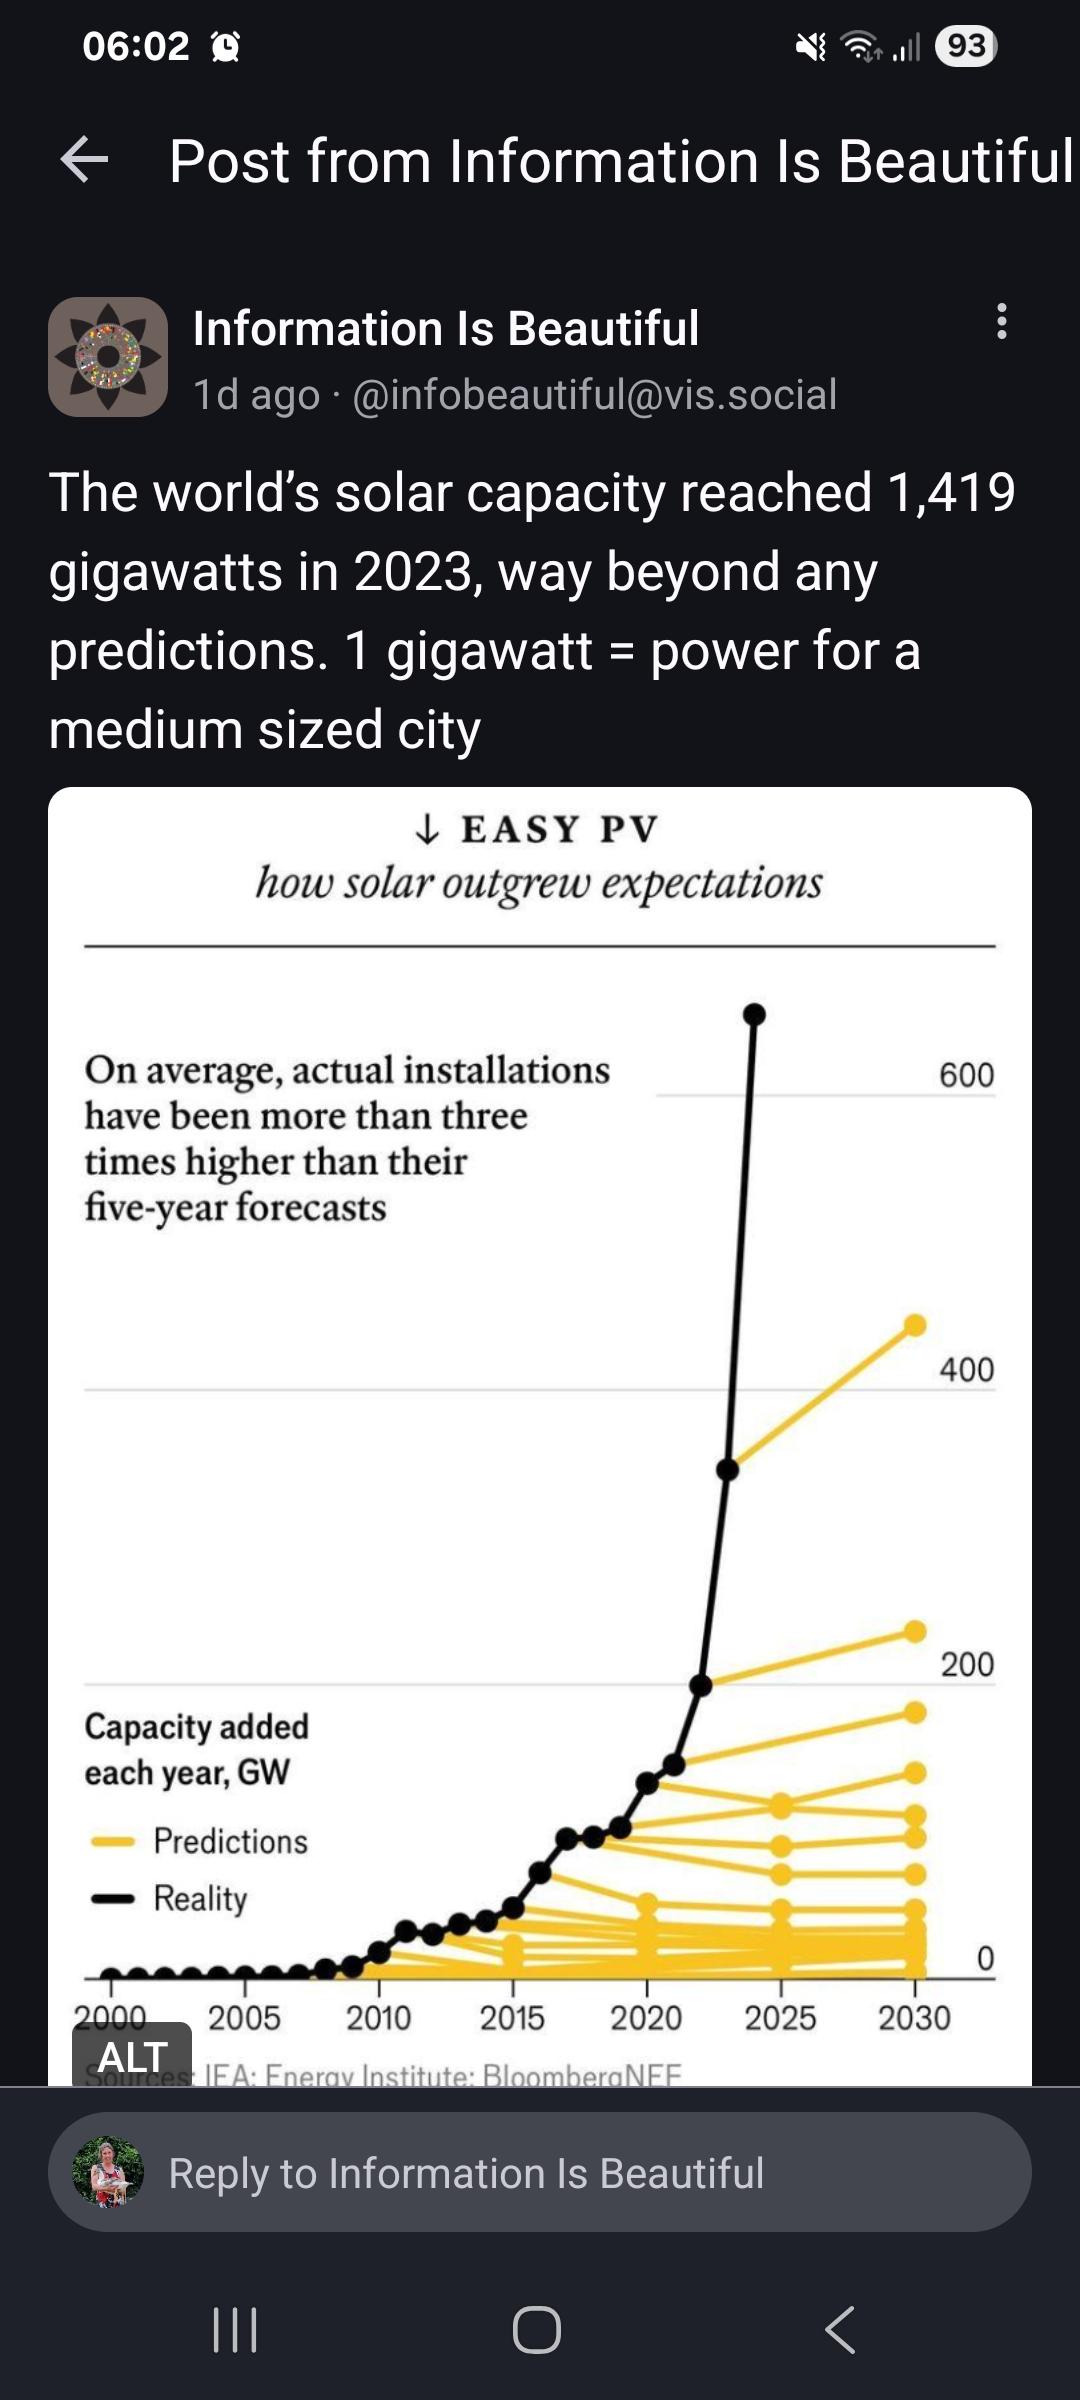
RE: https://vis.social/@infobeautiful/116109430224379547
Hi, it's me, from the "BloombergNEF" cited in that chart. While directionally accurate, 2024 was not over 600GW (2025 was about 655GW but this chart is older than that). There is uncertainty around solar build data but not that much.
So it's a bad construction using incorrect data and I wish it would stop spreading around.
-
RE: https://vis.social/@infobeautiful/116109430224379547
Hi, it's me, from the "BloombergNEF" cited in that chart. While directionally accurate, 2024 was not over 600GW (2025 was about 655GW but this chart is older than that). There is uncertainty around solar build data but not that much.
So it's a bad construction using incorrect data and I wish it would stop spreading around.
This one, from "Information is Beautiful", (infobeautiful@vis.social), btw.
-
This one, from "Information is Beautiful", (infobeautiful@vis.social), btw.
It's annoying because this is a real thing, we have underforecasted (and the IEA has done so worse, and tbh I don't know the Energy Institute) and there is indeed a lot of solar, but this chart is not correct!
Information is beautiful only if it is true!
-
It's annoying because this is a real thing, we have underforecasted (and the IEA has done so worse, and tbh I don't know the Energy Institute) and there is indeed a lot of solar, but this chart is not correct!
Information is beautiful only if it is true!
@solar_chase Would it be possible for you to make a similar but correct chart? I would like to circulate one.
-
@solar_chase Would it be possible for you to make a similar but correct chart? I would like to circulate one.
@mjd yes, I have one coming up for clients and can probably send it round a few weeks after pub. But warning, it's not nearly so dramatic, and right now tells a different story.
(It is also only BNEF data, ie my team's data, because that is only fair. The IEA were cowards but I mostly see where they are coming from).
-
It's annoying because this is a real thing, we have underforecasted (and the IEA has done so worse, and tbh I don't know the Energy Institute) and there is indeed a lot of solar, but this chart is not correct!
Information is beautiful only if it is true!
@solar_chase misinformation is also beautiful ?
-
R relay@relay.an.exchange shared this topic
-
@solar_chase Would it be possible for you to make a similar but correct chart? I would like to circulate one.
@mjd They usually look something like this. Each line should state in what year it was valid.
This one is from 2021 (an unusual year) but still.
https://www.carbonbrief.org/exceptional-new-normal-iea-raises-growth-forecast-for-wind-and-solar-by-another-25/ -
@mjd yes, I have one coming up for clients and can probably send it round a few weeks after pub. But warning, it's not nearly so dramatic, and right now tells a different story.
(It is also only BNEF data, ie my team's data, because that is only fair. The IEA were cowards but I mostly see where they are coming from).
@solar_chase @mjd Please do share an accurate chart. I would love to help that spread.
-
RE: https://vis.social/@infobeautiful/116109430224379547
Hi, it's me, from the "BloombergNEF" cited in that chart. While directionally accurate, 2024 was not over 600GW (2025 was about 655GW but this chart is older than that). There is uncertainty around solar build data but not that much.
So it's a bad construction using incorrect data and I wish it would stop spreading around.
@solar_chase @futzle its about being attractively presented, not about the numbers (ive seen them blatantly wrong before. I wish they were right. Pretty isn’t enough
 )
) -
RE: https://vis.social/@infobeautiful/116109430224379547
Hi, it's me, from the "BloombergNEF" cited in that chart. While directionally accurate, 2024 was not over 600GW (2025 was about 655GW but this chart is older than that). There is uncertainty around solar build data but not that much.
So it's a bad construction using incorrect data and I wish it would stop spreading around.
@solar_chase I remembered seeing a similar graph on Wikipedia a while ago, so went to have a quick look at what graphs their solar power article currently uses. Turns out their version of this graph only goes up to 2016:
They do also have a more up-to-date breakdown of installations, just without the comparison to earlier predictions. That one puts 2023 as just under 450GW (peak), citing BloombergNEF, which is even higher than the Information is Beautiful graph! Do you know what's going on with that?
-
R relay@relay.mycrowd.ca shared this topic

