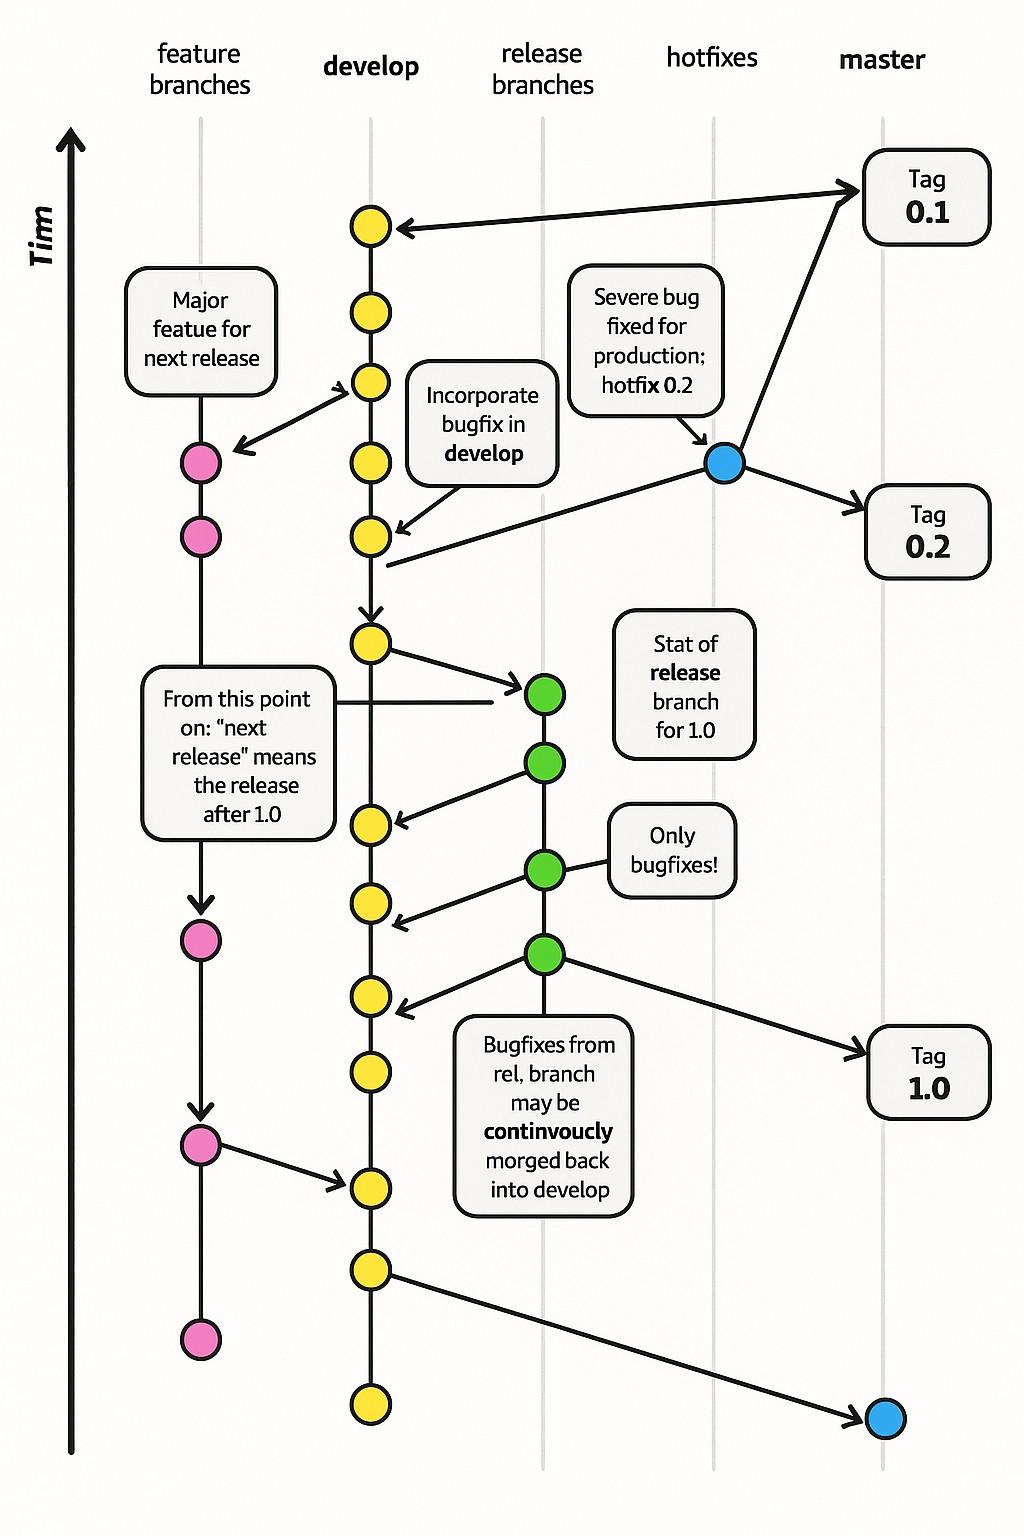
When I was in my early twenties I read The Visual Display of Quantitative Information from Tufte and agonized over making charts great for users.
-
When I was in my early twenties I read The Visual Display of Quantitative Information from Tufte and agonized over making charts great for users.
These days, Microsoft releases graphs like this
-
When I was in my early twenties I read The Visual Display of Quantitative Information from Tufte and agonized over making charts great for users.
These days, Microsoft releases graphs like this
@thomasfuchs I still have that book, probably bought it at the same time as you.
As to the graph, I bet the severe bug was a side effect of that branching.
-
When I was in my early twenties I read The Visual Display of Quantitative Information from Tufte and agonized over making charts great for users.
These days, Microsoft releases graphs like this
@thomasfuchs what is Tim doing on the left side?
-
When I was in my early twenties I read The Visual Display of Quantitative Information from Tufte and agonized over making charts great for users.
These days, Microsoft releases graphs like this
-
R relay@relay.mycrowd.ca shared this topic
-
When I was in my early twenties I read The Visual Display of Quantitative Information from Tufte and agonized over making charts great for users.
These days, Microsoft releases graphs like this
-
When I was in my early twenties I read The Visual Display of Quantitative Information from Tufte and agonized over making charts great for users.
These days, Microsoft releases graphs like this
@thomasfuchs this is what happens when you1 feed git-flow and github's own docs through a plagiarism machine.
microslop
 ︎
︎
-
-
When I was in my early twenties I read The Visual Display of Quantitative Information from Tufte and agonized over making charts great for users.
These days, Microsoft releases graphs like this
-
When I was in my early twenties I read The Visual Display of Quantitative Information from Tufte and agonized over making charts great for users.
These days, Microsoft releases graphs like this
@thomasfuchs What letter is that?

-
When I was in my early twenties I read The Visual Display of Quantitative Information from Tufte and agonized over making charts great for users.
These days, Microsoft releases graphs like this
@thomasfuchs yikes
-
When I was in my early twenties I read The Visual Display of Quantitative Information from Tufte and agonized over making charts great for users.
These days, Microsoft releases graphs like this
Paul Shryock (@paulshryock@phpc.social)
Folks will do literally anything to avoid pushing to `main`. #Git #SoftwareEngineering #Fear

PHP Community on Mastodon (phpc.social)
-
I have so many question right now.
Did... anyone at Microsoft approve this chart? How come they didn't notice so many glaring errors that produced by AI?
-
@thomasfuchs What letter is that?
@bplein If you're lost, you can look and you will find me
Timn after Timn -
I have so many question right now.
Did... anyone at Microsoft approve this chart? How come they didn't notice so many glaring errors that produced by AI?
@NovemDecimal the technical term for this is “not giving a shit”
-
@thomasfuchs so much of this "article" is factually incorrect. Literally bottom of the barrel slop.
"A commit is a change to one or more files on a branch."
-
@bplein If you're lost, you can look and you will find me
Timn after Timn@thomasfuchs I thought some developer named Timmmm was going back in time.
-
When I was in my early twenties I read The Visual Display of Quantitative Information from Tufte and agonized over making charts great for users.
These days, Microsoft releases graphs like this
@thomasfuchs the longer I look the worse it gets. “Tim” had me laughing but then I looked at where they put release branches and how they ordered the tags… I am so confused.
-
@thomasfuchs Automating contemptuous degradation!
-
When I was in my early twenties I read The Visual Display of Quantitative Information from Tufte and agonized over making charts great for users.
These days, Microsoft releases graphs like this
@thomasfuchs did they just take the original (https://nvie.com/posts/a-successful-git-branching-model/) and run it through an image generator?
-
When I was in my early twenties I read The Visual Display of Quantitative Information from Tufte and agonized over making charts great for users.
These days, Microsoft releases graphs like this
@thomasfuchs But really, who doesn't continvoucly morg every once in a while?
